
Few financial decisions carry as much emotional weight and mathematical confusion as choosing between taking on a 30-year mortgage or signing another annual lease. Family dinners, social media feeds, and well-meaning relatives repeat the same tired script: renting is just throwing your money away into a landlord’s pocket. Yet, rushing into homeownership without analyzing the underlying balance sheet often leaves buyers house-poor, trapped beneath mortgage interest, property taxes, structural repairs, and massive transaction friction.
When I’m modeling wealth sheets for clients, I encourage them to look past emotional homebuyer marketing and evaluate housing options like an institutional investor evaluating capital assets.
To understand how to choose between renting and buying a house, you must compare the unrecoverable costs on both sides of the ledger. Think of your choice as choosing between two different types of long-haul transportation. Renting is like boarding a high-speed passenger train—you buy a temporary fare ticket, step aboard, and pay a predictable fee to travel forward without worrying about broken engines, track maintenance, or wheel replacements. When you reach your station, you walk off the platform with only your luggage, but you paid zero upkeep along the way. Buying a home is like purchasing a heavy commercial freight truck. You own the physical chassis and build long-term asset value, but you bear total financial responsibility for expensive engine overhauls, blown tires, registration taxes, and high highway tolls.
The financial break-even point is the exact mileage mark down the road where the equity you accumulate in the truck chassis finally outweighs the heavy upfront buying fees and maintenance overhead. Map that crossover for your market with the Rent vs. Buy Calculator.
The Sunk Cost Fallacy: Why Renting Isn’t Always “Throwing Money Away”
In our housing cost stress testing, the idea that rent is 100% unrecoverable waste while a mortgage payment is 100% wealth building continuously falls apart under audit. Every housing path carries unrecoverable costs—money spent that never returns to your net worth.
When you rent, your unrecoverable cost is simple: it is your base monthly rental check. You hand cash to a landlord, and in exchange, you receive shelter, flexibility, and zero exposure to structural liabilities. Budget rent growth with the Rent Calculator.
When you buy a home, your monthly check splits into two buckets: equity building (principal repayment) and pure unrecoverable loss. During the initial 7 to 10 years of a standard mortgage, the overwhelming majority of your monthly payment pays off bank interest. Add in non-negotiable property taxes, homeowners insurance, HOA dues, and structural maintenance, and you quickly discover that a massive portion of homeownership cash flow vanishes without building a single dollar of home equity. See how P&I, tax, and insurance stack in our PITI and escrow guide and the interest-heavy early years in the principal vs. interest split guide.
What’s more, tying up $80,000 in a down payment removes that capital from liquid investment markets. If that $80,000 were invested in low-cost index funds earning a historic 7% to 8% real return, it would generate substantial compounding wealth. That foregone growth is an invisible, unrecoverable opportunity cost of homeownership that must be factored into your math. Stress-test compounding with the Compound Interest Calculator and size your down payment target with the Down Payment Calculator.
True Break-Even = Point Where Accumulated Home Equity Outweighs Transaction Friction + Unrecoverable Costs
Step-by-Step: The Investor’s Method for Manual Cost Comparison
To determine whether purchasing or leasing creates greater net worth over a given timeline, use this systematic underwriting process:
- Quantify Total Rent Outflows: Calculate your annual rent payments, adjusting for a realistic annual rent escalation factor (typically 3% to 5% based on local market history).
- Isolate Total Unrecoverable Buying Costs: Sum your year-one mortgage interest, property taxes, homeowners insurance, HOA fees, and routine maintenance reserves (budget 1% of the home’s value per year).
- Account for Transaction Friction: Calculate upfront closing fees (typically 2% to 4% of the purchase price) and anticipated future selling costs (6% to 7% for real estate agent commissions and transfer taxes).
- Calculate Capital Opportunity Costs: Determine the annual investment yield lost by using your cash for a down payment and closing costs instead of broad-market index funds.
- Project Net Asset Appreciation: Estimate conservative annual home appreciation (typically 3% to 4% over long windows) minus your total unrecoverable buying costs.
- Identify the Crossover Point: Map both financial paths across a 10-year timeline to locate the exact year where net home equity offsets transaction friction and unrecoverable ownership costs.
Expressed in financial underwriting terms, these core evaluation formulas run as follows:
Annual Unrecoverable Rent Cost = Monthly Rent × 12
Annual Unrecoverable Buying Cost = Mortgage Interest + Property Taxes + Maintenance Reserves + Insurance/HOA
Down Payment Opportunity Cost = Down Payment Cash × Assumed Annual Market Return Rate
Net Break-Even Horizon = Total Upfront & Selling Friction ÷ (Annual Unrecoverable Rent − Annual Unrecoverable Buying Cost)
Model mortgage interest and P&I with the Mortgage Payment Calculator or full escrow-style breakdown in the Mortgage Calculator. Pull amortization schedules from the Amortization Calculator when you need month-by-month interest totals.
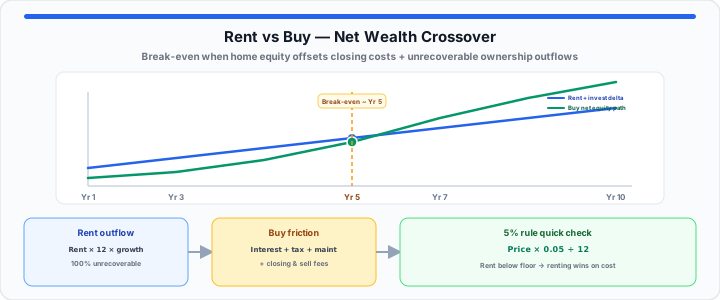
Typical crossover timeline (illustrative suburban scenario)
Yr 1 · Yr 3 · Yr 5 (Break-Even) · Yr 7 · Yr 10
Before Year 5, renting is often cheaper on a net-cost basis. After Year 5, buying can accumulate greater net wealth—if you stay long enough for equity to absorb sell-side friction. Your local math may differ; run your inputs in the Rent vs. Buy Calculator.
Instead of manually tracking multi-tiered compounding interest brackets on scratch paper or running the risk of simple math slips while evaluating an open home offer under a tight deadline, you can drop your local market metrics directly into our interactive Rent vs. Buy Calculator to map your financial break-even timeline instantly.
Open Rent vs. Buy Calculator Open House Affordability Calculator
The 5% Rule: A Quick Bench Anchor for Market Sizing
In my experience breaking down market price-to-rent ratios, clients often need a quick sanity check before pulling full property tax records. A practical shortcut used by financial analysts is the 5% Rule.
The 5% Rule estimates the annual unrecoverable cost of owning a home as roughly 5% of its total purchase price, broken down into three core components:
- 3.0% for Capital Costs: The combination of mortgage interest paid to the bank and foregone investment returns on your down payment.
- 1.0% for Property Taxes: The national baseline average for municipal real estate taxes.
- 1.0% for Maintenance and Upkeep: The minimum annual capital reserve needed to replace roofs, HVAC units, and plumbing over time.
To apply this rule, multiply a home’s list price by 5% and divide by 12. If you can rent an equivalent home for less than that monthly benchmark, renting is statistically cheaper on an unrecoverable cost basis.
For example, on a $450,000 home:
Annual Unrecoverable Benchmark = $450,000 × 0.05 = $22,500 per year
Monthly Unrecoverable Floor = $22,500 ÷ 12 = $1,875 per month
If an equivalent rental house down the street costs $1,650 per month, renting holds a clear unrecoverable cost advantage. You can rent, invest the price difference, and build wealth faster than a buyer on that specific property. Pair this shortcut with buying-power limits from the home buying budget guide and income stress tests in the mortgage payment vs. monthly income guide.
The 10-Year Horizon Grid: Comparing Total Outflows
To highlight how market dynamics alter break-even timelines, let’s examine three distinct regional housing scenarios across a decade-long holding period:
| Market Profile & Target Zone | Baseline Home Price / Rent Ratio | Upfront Transaction Friction | 5-Year Unrecoverable Buying Costs | Required Horizon to Break Even | Strategic Underwriting Verdict |
|---|---|---|---|---|---|
| High-Cost Urban Core (e.g., San Francisco, NYC) | High (Ratio: 28–32) Price: $950,000 / Rent: $2,800 |
$38,000 (Closing fees & transfer tax) | $265,000 (High taxes & mortgage interest) | 9 to 11+ Years | Strong Rent Advantage. Capital is better deployed in diversified financial markets. |
| Suburban Growth Zone (e.g., Atlanta, Phoenix) | Moderate (Ratio: 16–19) Price: $420,000 / Rent: $2,100 |
$14,700 (Standard closing friction) | $112,000 (Balanced interest & tax burden) | 4 to 5 Years | Balanced Horizon. Buying makes sense if you plan to stay in place past 5 years. |
| Low-Cost Midwest Zone (e.g., Cleveland, St. Louis) | Low (Ratio: 10–13) Price: $210,000 / Rent: $1,700 |
$7,350 (Low entry fee burden) | $51,000 (Low mortgage principal base) | 2 to 3 Years | Strong Buy Advantage. High rental yields make homeownership an immediate equity builder. |
For monthly savings toward a future down payment while you rent, see how much to set aside each month for a down payment.
Frequently Asked Questions
What is a price-to-rent ratio, and how does it help you choose between renting and buying a house?
The price-to-rent ratio is calculated by dividing the median home purchase price in an area by the total annual rent for an equivalent property. A price-to-rent ratio of 15 or lower indicates that homeownership is generally favored, while a ratio above 21 signals that renting offers significant unrecoverable cost savings.
How do upfront closing costs affect the length of time it takes to reach a rent vs. buy break-even point?
Upfront closing costs—such as lender origination charges, title insurance, home inspections, and recording taxes—typically add 2% to 4% of the total purchase price to your initial outlay. Because these fees represent pure unrecoverable transaction friction, higher closing costs push your financial break-even horizon further into the future, requiring a longer holding period to recoup your initial cash outlay.
Why do early mortgage payments contain higher unrecoverable interest loads than payments made in later years?
Standard fixed-rate mortgages follow an amortization schedule where monthly payments remain constant, but interest calculations are based on your remaining loan balance. In the initial years of a loan, when the principal balance is at its highest, the vast majority of your monthly check goes toward covering bank interest. As the principal balance steadily drops over time, a larger share of each payment shifts toward principal reduction and home equity build.
How does down payment opportunity cost factor into the long-term rent vs. buy balance?
When you buy a home, the cash used for a down payment is locked into physical real estate equity. Had that money stayed in liquid financial markets, it could have generated compound investment returns. If expected stock market returns exceed your home’s appreciation rate, that lost growth represents an invisible unrecoverable cost of homeownership that extends your break-even timeline.