
What your lender approves is rarely what your checking account survives. I have reviewed budgets where a couple cleared underwriting at 32% front-end DTI, then ran out of cash by week three because daycare, commuting, and insurance never appeared on the loan application.
Think of your monthly income like a bridge load rating. The mortgage is not the only weight crossing that span. Taxes, insurance, maintenance, and everyday life stack on top of principal and interest. Stress-test the full load before you sign—not just the P&I quote on a listing sheet.
Run the payment simulation: Enter your home price, down payment, rate, tax, and insurance in our Mortgage Payment Calculator, then compare the estimated total monthly housing cost against your income.
Phase 1: Calibrating the Base Net Income
To get started, separate what you earn from what you actually spend. Gross salary is the number on your offer letter. Take-home pay is what hits your bank after federal tax, state tax, health premiums, and retirement deferrals.
Lenders size loans from gross income because it is standardized across borrowers. In my experience, first-time buyers who budget from gross overestimate spending room by twenty to thirty percent. A $100,000 salary might gross $8,333 per month but net closer to $5,800 after typical withholding—that gap changes how a $2,300 housing payment feels.
Run your paycheck through the Take Home Paycheck Calculator before you compare any mortgage quote to monthly income. Retirement contributions are especially easy to forget: they lower take-home cash but do not reduce the housing ratio lenders calculate.
- Record gross monthly income. Use salary plus documented bonus averages, not one-time commissions.
- Subtract fixed pre-tax deductions. Health insurance and 401(k) deferrals leave checking before you pay the mortgage.
- Compare net cash to the full housing bill. If housing eats half your take-home, groceries and savings fight for scraps.
Phase 2: Stress-Testing the 28% Tolerance Limit
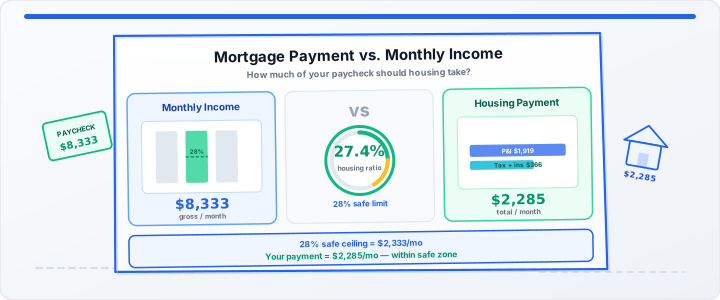
Moving onto the ratio banks treat as a structural ceiling, the conventional front-end limit targets 28% of gross monthly income for total housing costs. That is your safe zone on the gauge. The caution band runs from 29% to 35%. Above 35%, households often enter house-poor territory where one surprise bill triggers overdraft fees.
The safe housing ceiling formula
Max Housing Payment = Gross Monthly Income × 0.28
At $8,333 gross per month, the ceiling sits near $2,333. That cap covers P&I, property tax, homeowners insurance, and HOA—not principal and interest alone. A quote showing $1,900 P&I plus $450 tax and insurance already lands at $2,350, slightly over the line.
Reading your personal housing ratio
Housing Ratio = Total Monthly Housing Cost ÷ Gross Monthly Income
In our testing with the payment calculator, buyers who enter annual tax and insurance get a ratio closer to real life than those who compare P&I alone. Cross-check the result on the Debt-to-Income Ratio Calculator if you also carry car or student loans. The back-end limit adds those debts on top of housing.
For a full buying-power walkthrough including the 28/36 rule, see our home buying budget guide or run price-level math on the House Affordability Calculator.
Phase 3: Environmental Cost Multipliers
A principal-and-interest payment is only the steel frame of your monthly housing load. Property taxes reassess after purchase in many counties. Insurance premiums jump when you raise dwelling coverage. HOA dues on condos stack flat every month even when your loan balance drops.
In practical environments, I budget 1% to 2% of home value annually for maintenance on top of the mortgage bill. A $350,000 home might need $3,500 to $7,000 yearly for HVAC service, appliance replacements, and exterior upkeep—roughly $290 to $580 per month that never appears on a basic P&I calculator.
| Income Level (Gross/mo) | 28% Housing Cap | What to Model in the Calculator |
|---|---|---|
| ~$5,000 | ~$1,400/mo | Entry price, higher down payment, tax rate by county |
| ~$8,333 | ~$2,333/mo | Full P&I + annual tax + insurance splits |
| ~$12,500 | ~$3,500/mo | Add HOA line manually; reserve 1% upkeep off gross |
The Mortgage Payment Calculator models P&I with optional annual tax and insurance converted to monthly escrow-style lines, plus a donut chart so you see how each slice compares to your income cap. For a numeric-only breakdown without charts, use the Mortgage Calculator.
Simulation Summary: Which Tool to Run Next
- Have a listing price in mind? Stress-test P&I, tax, and insurance in the Mortgage Payment Calculator, then divide the total by gross income.
- Starting from salary only? Reverse-engineer a price ceiling on the House Affordability Calculator.
- Comparing net pay to the bill? Calibrate take-home first on the Take Home Paycheck Calculator, then check whether housing leaves room for savings.
Initialize Mortgage Payment Simulation
Frequently Asked Questions About Mortgage Payment vs. Income
- What percentage of monthly income should go to a mortgage?
- Conventional guidance caps total housing at 28% of gross monthly income. That includes P&I, taxes, insurance, and HOA—not the loan payment alone. Above 35%, many households feel house-poor.
- Should I use gross or net income for mortgage budgeting?
- Lenders use gross income for DTI. For personal stress-testing, compare the full housing payment to take-home pay too. A ratio that passes underwriting can still fail your real monthly budget.
- What counts as total housing cost vs mortgage payment?
- Total housing includes P&I, property tax, homeowners insurance, PMI when applicable, and HOA fees. Model tax and insurance in the payment calculator for a realistic ratio.
- What happens if my housing ratio exceeds 35%?
- Discretionary spending, emergency savings, and retirement contributions get squeezed. One car repair or medical bill can push the budget into overdraft territory.
- How do I stress-test a specific home price against my income?
- Enter home price, down payment, rate, and annual tax and insurance into the Mortgage Payment Calculator. Divide estimated total monthly housing cost by gross monthly income.