
You just finished a grueling three-hour bench block, your safety goggles left red pressure rings around your eyes, and your titration flask finally holds a permanent, faint pink hue. You plug your raw volumetric numbers into your notebook, run the calculation, and stare at the result in total disbelief: your experimental output sits 12% away from the known textbook value. Panic sets in. Did a dirty burette ruin your entire afternoon, or is this variance completely normal for student bench work?
When I'm grading lab data sets or troubleshooting physics apparatuses with students, I see this exact anxiety play out every single week. Students frequently assume that any gap between their measured tally and the accepted literature standard indicates a complete operational failure. In actual physical research, raw trial data almost never matches theoretical perfection down to the third decimal place. To evaluate how far off your physical trial landed without guessing, you must calculate percent error.
Think of percent error like checking your car's dashboard display against a roadside speed radar gun. If your dashboard speedometer reads exactly 60 miles per hour, but an absolute radar gun measures your true velocity at 55 miles per hour, that 5 mph difference isn't an abstract guess. It represents a real-world variance value that you need to scale directly against the true 55 mph baseline to understand how miscalibrated your dashboard display actually is. Drop your observed and true values into our Percent Error Calculator when you want the arithmetic and step-by-step breakdown under a deadline.
The Accuracy Metric: Why Raw Variances Matter in Scientific Reporting
In practical environments, raw numerical differences are inherently misleading. If you miss a 100-gram mass calibration by 5 grams, that 5-gram offset is massive. However, if you miss a 10,000-gram industrial payload target by that exact same 5 grams, your measurement is exceptionally tight. Reporting the raw numeric difference alone tells only half the story.
Calculating percent error scales your absolute offset against the actual magnitude of the accepted theoretical baseline. This scaling converts raw deviation into a standardized percentage, allowing lab partners, teaching assistants, and peer reviewers to judge data quality across vastly different measurement scales.
In my experience tracking experimental drifts, distinguishing between systematic calibration offsets and random procedural slips starts right here. When every student in a lab section trends consistently high by 8%, we immediately inspect our digital balance calibrations or check our reagent purity. When data points scatter randomly both above and below the baseline, we look at student volumetric parallax reading habits instead. For spread across repeated trials, pair this check with the Statistics Calculator or Z-Score Calculator when you need precision language separate from accuracy.
Step-by-Step: Working the Classical Lab Error Equation
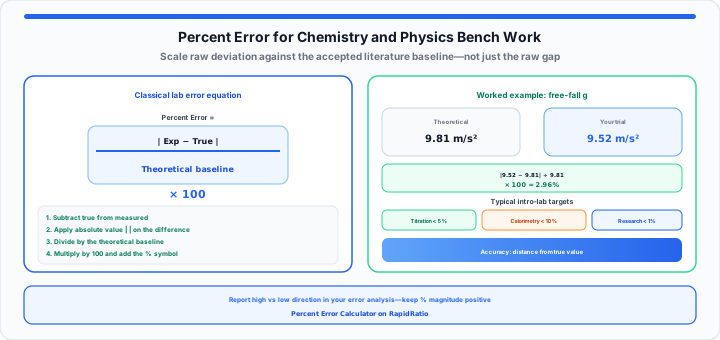
To get started quantifying experimental accuracy on paper, follow this straightforward four-step manual calculation sequence.
- Subtract the true baseline from your measured value: Take your raw experimental measurement and subtract the accepted theoretical value from it. This yields your raw error deviation, which may turn out positive or negative.
- Apply the absolute value shield: Enclose that subtraction result within absolute value vertical bars. Stripping away negative signs ensures your calculation numerator reflects a pure physical distance from the baseline.
- Divide by the theoretical baseline value: Take that positive numerator and divide it by the accepted theoretical value. This scales your offset relative to the magnitude of what you are measuring.
- Multiply by 100 to convert to a percentage: Multiply the resulting decimal scalar by 100 and affix the percent symbol (%).
Percent Error = (|Experimental Value − Theoretical Value| / Theoretical Value) × 100
Numerator: Absolute distance (drops negative sign). Denominator: Accepted literature reference value.
The Absolute Value Shield: Handling Negative Deviations
When I evaluate student lab notebooks, one of the most frequent arithmetic mistakes I circle in pen is a negative percent error value. If your measured boiling point for an ethanol solution comes out to 76.5 °C against a theoretical baseline of 78.3 °C, your raw subtraction yields −1.8 °C.
However, percent error measures the magnitude of inaccuracy, not its direction. The absolute value vertical bars in the numerator act as a protective shield, stripping away the negative sign before you divide by the baseline. Whether your experimental yield lands above or below the accepted literature benchmark, your final reported percent error must remain a positive number when your rubric calls for absolute percent error.
When you need to communicate whether your raw data drifted high or low, document that specific direction in your written discussion section under error analysis, rather than introducing a negative sign into the final equation. If your instructor wants signed bias, the Percent Error Calculator includes a directional mode for that reporting style.
The Quick Reference Lab Benchmark Sheet
In introductory and advanced lab courses, different physical setups carry distinct theoretical baselines and expected variance ranges. The reference table below tracks classic chemistry and physics experiments, comparing sample bench measurements against standard literature constants.
| Experiment & Measured Variable | Theoretical Baseline | Experimental Trial Value | Absolute Difference | Calculated Percent Error |
|---|---|---|---|---|
| Free-Fall Gravity Acceleration (g) | 9.81 m/s² | 9.52 m/s² | 0.29 m/s² | 2.96% |
| Boiling Point of Distilled Water (1 atm) | 100.0 °C | 101.4 °C | 1.4 °C | 1.40% |
| Molar Mass of Sodium Chloride (NaCl) | 58.44 g/mol | 60.12 g/mol | 1.68 g/mol | 2.87% |
| Density of Solid Aluminum Block | 2.70 g/cm³ | 2.51 g/cm³ | 0.19 g/cm³ | 7.04% |
| Ideal Gas Constant (R) | 0.08206 L·atm/(mol·K) | 0.0865 L·atm/(mol·K) | 0.00444 L·atm/(mol·K) | 5.41% |
In practical lab workflows, instead of manually wrestling with nested absolute value bars on a scratchpad or running the risk of simple decimal slips while writing up your lab analysis under a tight deadline, you can drop your raw trials directly into our interactive Percent Error Calculator to isolate your experimental accuracy instantly. For density-based labs, cross-check handbook constants using the Density Calculator and the density authentication guide. For before-and-after percent change wording (different denominator logic), use the Percentage Change Calculator instead.
Open Percent Error Calculator Open Statistics Calculator
Frequently Asked Questions
Can a calculated percent error value ever result in a negative number?
No. Standard percent error calculations incorporate absolute value operations in the numerator, which eliminates negative signs. The metric measures total percentage deviation from a true baseline, regardless of whether your trial fell short or exceeded the benchmark. If you wish to report directionality (whether your result was over or under), document that observation in your written lab narrative rather than including a negative sign in the output value when absolute percent error is required.
What is a universally acceptable percent error margin for secondary school science labs?
While acceptable thresholds depend heavily on equipment precision, introductory high school and undergraduate general chemistry labs usually target a percent error under 5% for quantitative tasks like titrations, and under 10% for thermodynamics or calorimetry setups where ambient heat loss is difficult to isolate. In advanced research laboratories using calibrated analytical instruments, target margins often drop well below 1%.
How does the difference between precision and accuracy alter how you track errors in a physics data sheet?
Accuracy reflects how close your experimental measurements land to the true theoretical baseline (which is directly measured by percent error). Precision reflects how tightly your repeated trial measurements cluster near one another, regardless of where the true baseline lies (measured by standard deviation or percent relative standard deviation). An experiment can be highly precise by hitting 9.12 m/s², 9.13 m/s², and 9.11 m/s² for gravitational acceleration, yet remain inaccurate due to a systematic sensor calibration error.