
Few sounds in facility management hit with the same gut-punch intensity as walking into a server closet and hearing the high-pitched hum of moisture warning alarms. You open the rack door, and there it is: a subtle sheen of micro-droplets clinging to an enterprise switch blade. In my experience managing server room thermal loads, most technicians make the mistake of trusting wall-mounted relative humidity sensors without realizing that relative percentages hide lethal micro-climates inside the rack chassis.
Enter your intake temperature and humidity into our Dew Point Calculator before you trust a hallway BMS readout. Pair it with the Heat Index Calculator when hot-aisle recirculation skews comfort metrics, and use the Wet-Bulb Calculator if you are comparing evaporative cooling limits across CRAC zones.
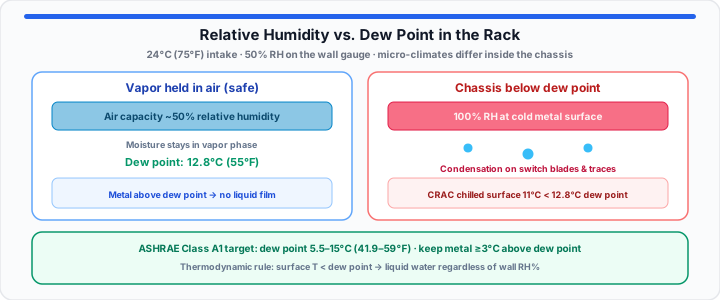
Relative Humidity vs. Dew Point in the Rack
Think of moisture saturation in server racks like a handheld sponge soaked under a running faucet. Relative humidity is just how squeezed that sponge currently is at a given air temperature. The dew point, however, is the exact, unyielding temperature threshold where the sponge gets completely oversaturated and starts dripping liquid straight onto your raised floor tiles. In a data centre, if your hardware metal drops below that invisible moisture line, it turns into a magnet for micro-droplets. Your circuit boards end up taking a microscopic bath while plugged directly into high-voltage power feeds.
Air acts like a thermal sponge: warm air holds significantly more water vapor than cold air. When I’m auditing rack psychrometric charts, I routinely catch engineering teams operating under the assumption that keeping relative humidity at 50% guarantees safety. If your intake air sits at 24°C (75°F) with 50% relative humidity, your dew point rests at a stable 12.8°C (55°F). However, if cold supply air from a Computer Room Air Conditioner (CRAC) unit chills a metallic chassis or localized copper conduit down to 11°C, water drops instantly out of suspension onto the metal, regardless of that reassuring 50% gauge readout on your wall monitor.
In our data centre hot-aisle testing, we often see extreme temperature gradients across high-density blade enclosures. A hot aisle pushing 38°C (100°F) might show a low 25% relative humidity, masking the fact that the absolute moisture volume in the room remains dangerously high. When that hot air recirculates back toward a colder intake zone, the sudden drop in air temperature forces the moisture out of the air and straight onto your components.
Thermodynamic reality: when metal surfaces drop below the room’s dew point temperature, water drops out regardless of relative humidity.
How to Calculate Dew Point in a Room (Manual Steps)
Learning how to calculate dew point in a room without relying solely on automated building management sensors requires isolating ambient dry-bulb temperature from relative moisture saturation.
To get started, follow this four-step manual psychrometric mapping process:
- Measure ambient intake temperature (T): Use a calibrated thermal hygrometer to capture dry-bulb air temperature at server intake grilles in Celsius.
- Log local relative humidity (RH): Capture the current relative humidity percentage at the exact same physical height and rack elevation.
- Apply the Magnus-Tetens baseline approximation: Subtract the humidity deficit constant from your ambient dry-bulb temperature reading using the standard HVAC formula ratio.
- Establish the surface temperature delta: Measure chassis surface temperatures across your intake manifolds using an infrared thermometer. Ensure all metallic components stay at least 3°C (5.5°F) above your calculated dew point threshold to prevent condensation.
In practical environments, you can calculate the baseline approximation using this standard engineering equation:
Dew Point Approximation (°C) = Ambient Temperature (°C) − ((100 − Relative Humidity) / 5)
For precise thermal engineering across wide temperature ranges, apply the full Magnus formula:
Dew Point (°C) = (243.12 × (ln(RH / 100) + ((17.62 × T) / (243.12 + T)))) / (17.62 − (ln(RH / 100) + ((17.62 × T) / (243.12 + T))))
Operating range: maintain intake air inside the optimal uptime zone to balance static safety and condensation protection. Data centre risk boundary: under-humidifying creates static hazards; over-humidifying triggers structural oxidation.
Instead of guessing moisture parameters on a paper chart or risking math slips while adjusting complex chiller settings under operational stress, pass your raw ambient values into the Dew Point Calculator, then plug CRAC runtime hours into the Electricity Cost Calculator to project monthly cooling utility loads.
Safe Humidity, Heat, and ESD Trade-offs
While high humidity leads to liquid dripping onto mainboards, over-correcting by over-drying your air introduces an equally destructive hazard: electrostatic discharge (ESD). Driving relative humidity below 30% or pulling your absolute dew point below 5.5°C (41.9°F) turns your server room carpet and rack enclosures into a dry static field.
When technicians pull hot-swappable drives or handle RAM sticks in low-moisture air, static charges over 10,000 volts can jump across sensitive electronic traces. These micro-spikes can fry silicon IC chips instantly or degrade circuit pathways over time, causing mysterious, untraceable system crashes weeks later.
Maintaining safe humidity and heat levels for electronics requires adhering to defined standards established by the American Society of Heating, Refrigerating and Air-Conditioning Engineers (ASHRAE).
Facility environment profiles
| Profile | Allowable temp | Target temp | Safe RH | Dew point limits | Primary risk |
|---|---|---|---|---|---|
| ASHRAE Class A1 (enterprise data centre) | 15–32°C (59–89.6°F) | 18–27°C (64.4–80.6°F) | 8–80% RH (non-condensing) | 5.5–15°C (41.9–59°F) | Micro-condensation on cold copper and board traces |
| Standard office server closet | 18–24°C (64.4–75.2°F) | 21°C (69.8°F) | 40–55% RH | 7–12°C (44.6–53.6°F) | ESD buildup from unmonitored building HVAC drops |
| High-density hot-aisle array | 30–45°C (86–113°F) | 35°C (95°F) | 20–35% RH | Max 15°C (59°F) | Recirculation thermal spikes and insulation stress |
| Edge computing enclosure | 10–35°C (50–95°F) | 22°C (71.6°F) | 30–60% RH | 2–17°C (35.6–62.6°F) | Rapid external weather swings causing dew point drift |
Over-cooling or over-humidifying a data centre imposes a major financial penalty on your monthly utility bill. Many facilities run CRAC humidifiers and cooling chillers simultaneously—one system pumps moisture into the room while another strips it out—wasting thousands of kilowatt-hours every month. Model chiller and fan loads with the Electricity Cost Calculator after you lock your dew point targets.
Open Dew Point Calculator Open Electricity Cost Calculator
Common Server Room Dew Point Questions
How do you accurately calculate the optimal dew point for a server room or data centre?
Measure intake air temperature and relative humidity with a calibrated hygrometer. Apply the Magnus-Tetens formula or a psychrometric chart, then hold absolute dew point between 5.5°C and 15°C per ASHRAE Class A1 guidance.
What are the safest humidity and heat levels for running sensitive electronics?
Target 18°C to 27°C ambient with 40% to 50% relative humidity and dew point below 15°C to limit thermal throttling, static buildup, and oxidation.
Why is dew point a better environmental metric than relative humidity for data centres?
Relative humidity swings with temperature; dew point tracks absolute moisture and names the condensation temperature for cold rack metal.
What happens if the dew point in a server room gets too high?
Vapor condenses on boards and power supplies, raising short-circuit, corrosion, and arc-fault risk until hardware fails prematurely.