
The thermometer on your porch reads 92°F. You step outside and it feels like someone wrapped a damp blanket around your shoulders. Your weather app shows two different numbers — a "feels like" heat index and, buried in the technical section, a wet-bulb reading. They are not duplicates. They answer different survival questions.
To get started, enter your local air temperature and humidity into our on-page heat index calculator and wet-bulb calculator. Compare both before you schedule roof work, a youth soccer tournament, or a warehouse shift during a July heat dome.
Heat Index Explained: The "Feels Like" Number
Heat index is built for humans, not HVAC ducts. It estimates how hot shaded air feels on your skin when humidity chokes sweat evaporation. The National Weather Service publishes it during summer because dry-bulb temperature alone misleads the public.
Think of your body as a car radiator. On a dry 95°F afternoon in Phoenix, sweat evaporates fast — airflow through the grille keeps engine temperature manageable. Same thermometer reading in Houston at 70% relative humidity and the radiator clogs. Heat index captures that clog in one number.
Standard heat index math assumes you are in the shade with a light breeze near 5.7 mph. Direct sun on dark pavement can add 10–15°F of effective exposure. What this actually means for your day: a heat index of 103°F triggers NWS "Danger" advisories — heat exhaustion likely, heat stroke possible with prolonged work.
NWS heat index advisory bands
| Heat index | Risk label | What to do |
|---|---|---|
| 80–90°F | Caution | Hydrate; watch fatigue on long shifts |
| 90–103°F | Extreme Caution | Schedule breaks every 20–30 minutes |
| 103–124°F | Danger | Limit outdoor labor; buddy system required |
| 125°F+ | Extreme Danger | Cancel non-essential outdoor exposure |
Wet-Bulb Temperature Demystified
Wet-bulb temperature comes from a simpler physical picture. Wrap a wet cloth around a thermometer bulb. Blow air across it. Water evaporates and pulls heat away. The temperature the thermometer settles at — that is wet-bulb.
In my forecasting experience, wet-bulb is the number occupational safety teams watch when humid heat stops being a comfort issue and becomes a physiology issue. It measures the absolute ceiling on evaporative cooling in the current air mass. When wet-bulb approaches body temperature, sweat stops pulling heat off your skin.
Dry air drops wet-bulb far below dry-bulb. Saturated air pushes wet-bulb toward the actual air temperature. At 100% relative humidity, wet-bulb equals dry-bulb — no room left for evaporation. That is the steam-room effect that kills outdoor workers during tropical heatwaves.
The Critical Differences and Danger Zones
Moving onto the comparison most searchers actually need. Heat index tells you how miserable the afternoon will feel. Wet-bulb tells you whether your body can still cool itself at all.
- Heat index at 95°F: Uncomfortable. Dangerous with heavy exertion. Manageable with shade, water, and rest cycles.
- Wet-bulb at 95°F (35°C): A hard biological survivability threshold cited in heat-stress research. Healthy adults struggle to shed metabolic heat even sitting still.
- Measurement context: Heat index assumes shade and light wind. Wet-bulb is a property of the air itself — usable in sun or shade once you know temperature and humidity.
- Who uses each: TV meteorologists lead with heat index. Engineers, athletes, and military planners track wet-bulb for equipment limits and heat-stress tables.
A 95°F heat index on a dry desert afternoon might pair with a wet-bulb near 70°F — brutal to work in, but evaporation still works. A 95°F air temperature at 80% humidity might push wet-bulb above 85°F — a completely different medical risk profile from the same dry thermometer reading.
Run your humidity and temperature through the wet-bulb calculator alongside the heat index result. When wet-bulb climbs above 30°C (86°F), treat outdoor blocks as high-risk even if the heat index advisory looks merely orange instead of red.
Real-World Application: Planning a Hot Outdoor Shift
In our field testing with landscaping crews, the mistake we see every June is trusting one number. Here is a practical split-check before a four-hour asphalt-adjacent job.
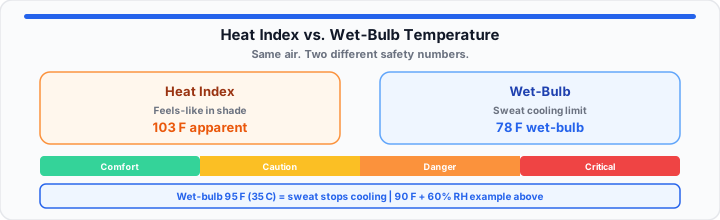
Forecast inputs: dry-bulb 90°F, relative humidity 65%. Heat index lands near 103°F — NWS Danger tier. That alone justifies shade tents and a 15-minute break every 30 minutes.
Same inputs on the wet-bulb side: roughly 78°F (25°C) wet-bulb. Evaporative cooling still functions, but margin is thin. Add direct sun on dark asphalt and effective exposure jumps above what either calculator shows. The crew lead adds electrolyte packets and moves the heaviest lifting before 10 a.m.
Now swap humidity to 85% at the same 90°F dry-bulb. Heat index rises toward 115°F. Wet-bulb climbs near 84°F (29°C). Same air temperature on the news ticker — completely different internal body stress. That is when we cancel non-essential pours and shift to indoor prep.
Same dry-bulb + higher RH = higher heat index AND higher wet-bulb
In practical environments, check both metrics at dawn, noon, and mid-afternoon. Humidity often peaks when the sun is highest — the worst combination for heat stroke.
Open Heat Index Calculator Open Wet-Bulb Calculator
Common Heat Metric Questions
Is heat index the same as wet-bulb temperature?
No. Heat index is a comfort scale for shaded conditions. Wet-bulb is the thermodynamic evaporative cooling limit. Use both during heatwaves.
Why is 35°C wet-bulb dangerous?
Near 35°C wet-bulb, sweat cannot evaporate fast enough to regulate core temperature. Heat stroke risk rises sharply even at rest.
Does heat index account for sun and wind?
It assumes shade and light wind. Sun and calm air make real exposure worse than the published index.
Which calculator should I use first?
Start with heat index for daily planning. Add wet-bulb when humidity is high or work is strenuous.
Can heat index be lower than air temperature?
In very dry air, apparent temperature can dip slightly below dry-bulb. The NWS low-humidity adjustment handles that edge case.