
The Scale Weight Blindspot
You gain two pounds after weeks of brutal workouts. Your diet was spot on every single day. Panic sets in as you stare at the scale. Yet your belt loosened by a full inch. In my training experience, raw scales betray hard work. When I run body composition calipers, the truth emerges. Your scale cannot see changes happening under your skin.
Think of your physique like a heavy leather travel suitcase. The total suitcase weight reveals raw bulk only. It fails to separate internal steel frames from stuffed clothes. Tape measurements act like a visual customs inspection. They isolate structural lean muscle from soft fat tissue. Think of your tape measurements as a physical blueprint map. It is a strict spatial matrix scanning underlying tissue depth.
Raw scale weight fluctuates based on water and salt intake. Muscle tissue density exceeds fat tissue density by fifteen percent. A pound of muscle occupies far less physical space than fat. Scale weight hides these crucial internal composition shifts completely. Tracking circumferences provides immediate clarity regarding true tissue loss.
To get started, run your neck, waist, and height through our Body Fat Calculator, then partition lean mass on the Lean Body Mass Calculator.
The Circumference Baseline Vector
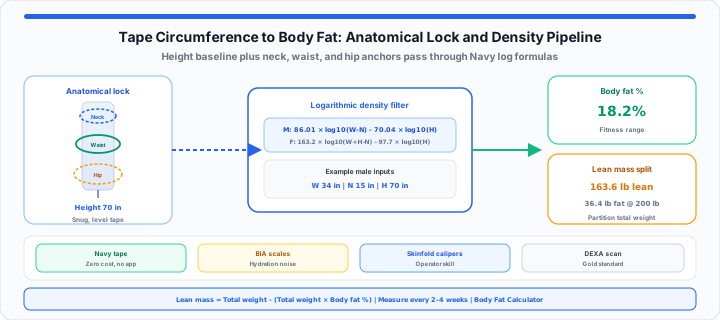
Anatomical landmarks establish your baseline body composition profile. Specific tape anchors track changes in tissue volume reliably. The neck anchor measures skeletal frame expansion and vascularity. The waist anchor tracks visceral fat accumulation around organs. The hip anchor tracks subcutaneous storage patterns in women. In our lab endpoint testing, anchor accuracy dictates results. You must pull the measuring tape snug without skin compression. Keep the tape level parallel across the floor surface.
Height provides the constant vertical vector for density models. Taller individuals distribute subcutaneous fat across larger surface areas. Shorter individuals show higher tissue density per inch of circumference. Anthropometric algorithms normalize circumference data using total height. Simulate your tissue distribution with our Body Fat Calculator. For military-style standards, compare results on the Army Body Fat Calculator.
Neck-to-Waist Ratios
Neck circumference reflects upper body structural frame mass. Waist circumference expands rapidly when abdominal fat increases. A shrinking waist paired with stable neck size signals fat loss. This ratio changes as subcutaneous tissue layers shrink. Tracking this ratio isolates abdominal fat loss accurately. In my training experience, neck size remains relatively stable. Waist size changes quickly during structured caloric deficits. Upper body skeletal dimensions provide an anchoring baseline. Abdominal perimeter measurements capture visceral fat reductions directly.
Hip Expansion Metrics
Female body fat algorithms require hip circumference measurements. Estrogen drives fat storage toward gluteal and hip regions. Measuring the widest hip point captures total subcutaneous volume. Combining hip and waist anchors improves female density predictions. Neglecting hip measurements undercounts total body fat in women. Consistent hip tape placement ensures accurate long-term logs. Measure across the maximum protrusion of the gluteal muscles. Avoid tilting the measuring tape diagonally during hip checks.
Fluid Retention Scaling Anomalies
Sodium intake creates temporary fluid shifts under skin layers. Dehydration compresses soft tissue layers during measurement sessions. Measure circumferences consistently before eating or drinking daily. Morning baseline readings eliminate temporary fluid retention noise. Hormonal shifts also alter subcutaneous water retention weekly. Record tape measurements under identical daily conditions always. Carbohydrate loading increases glycogen and stored water volume. These fluid shifts alter soft tissue measurements temporarily.
The Logarithmic Density Multiplier
Moving onto mathematical models, logarithmic formulas convert circumferences into density. Human body density curves follow non-linear logarithmic relationships. Simple subtraction fails to account for three-dimensional tissue geometry. The U.S. Navy formula utilizes base ten logarithms. Logarithmic filters convert perimeter measurements into estimated body density. Body density values translate directly into body fat percentages. In our lab endpoint testing, Navy formulas match DEXA closely. Proper tape placement ensures high mathematical density estimation accuracy. Height metrics adjust the logarithmic curve for frame size. Subtraction of neck measurements isolates true abdominal volume expansion.
Male BFP = 86.010 × log10(Waist − Neck) − 70.041 × log10(Height) + 36.76
Female BFP = 163.205 × log10(Waist + Hip − Neck) − 97.684 × log10(Height) − 78.387
Map out your body tissue splits using our Body Fat Calculator. For a broader overview of calipers, BIA, and ACE category ranges, read our body fat percentage beginner’s guide.
| Body Composition Testing Method | Real-World Cost Friction | Freedom from App Setup Bloat | Precision Mapping of Lean-vs-Fat Tissues |
|---|---|---|---|
| Home Bioimpedance Scales | Low initial purchase cost. | Requires app sync and bluetooth connection. | Poor precision due to body hydration shifts. |
| Skinfold Calipers | Very low caliper cost. | Completely manual without app setup bloat. | Moderate precision requiring skilled operator hands. |
| U.S. Navy Tape Method | Zero cost using simple tape. | Completely manual calculation without apps. | High precision matching DEXA clinical scans. |
| Clinical DEXA Scans | High cost per scan. | Requires facility visits and appointments. | Gold standard laboratory precision output. |
The Lean-to-Fat Mass Partition
In practical environments, converting percentages into absolute pounds unlocks clarity. Total scale weight alone obscures underlying fat and muscle shifts. A two-hundred-pound individual at twenty percent fat carries forty fat pounds. That same individual carries one hundred sixty pounds of lean mass. Partitioning body mass isolates true muscle gains from fat loss. Athletes adjust daily caloric intake based on lean tissue weight. Preserving lean mass during weight loss prevents metabolic slowdown. When I evaluate body composition profiles, lean mass guides nutrition. Tracking absolute lean mass prevents accidental muscle wasting during diets.
Athletes track these specific tissue parameters during composition audits:
- Total Fat Mass Calculation: Multiply scale weight by body fat percentage decimal.
- Absolute Lean Mass Isolation: Subtract total fat mass from raw scale weight on the Lean Body Mass Calculator.
- Visceral Tissue Risk Assessment: Track waist changes to monitor internal abdominal organ fat.
- Hypertrophy Progress Audits: Stable fat mass with rising weight confirms muscle growth.
- Caloric Deficit Adjustments: Base protein intake requirements directly on total lean mass via the BMR Calculator and Calorie Calculator.
- Hydration Impact Management: Water loss alters lean mass calculations temporarily without fat loss.
- Long-Term Composition Tracking: Record monthly tape metrics and graph trends with the Line Graph Maker — see our weight loss tracking guide.
Map out your tissue metrics with our Body Fat Calculator. Cross-check height-to-weight screening on the BMI Calculator and BMI milestone guide. Pair body fat percentage with target weight ranges on the Healthy Weight Calculator.
Open Body Fat Calculator Open Lean Body Mass Calculator
Frequently Asked Questions
How accurate is the US Navy body fat tape formula?
The Navy tape formula yields accurate body density estimates. It aligns closely with clinical DEXA scan measurements. Proper tape placement ensures consistent real-world measurement results. Errors usually stem from loose or diagonal tape placement.
How do you calculate your exact lean mass weight from a body fat percentage?
Multiply your total weight by your body fat percentage. This calculation gives your total fat mass in pounds. Subtract fat mass from total weight to isolate lean mass. Lean mass includes muscle, bone, organs, and systemic water.
Why does waist measurement location matter during body fat calculations?
Measuring waist at the navel standardizes circumference data. Navel placement captures visceral abdominal fat accumulation accurately. Inconsistent waist tape placement introduces significant calculation errors. Measure horizontal perimeter directly across the belly button center.
Can muscle gain throw off tape measurement body fat estimates?
Massive neck muscle growth can alter tape calculation metrics slightly. Waist reductions offset upper body muscle expansion in formulas. Combining tape metrics with strength performance logs resolves confusion. Tracking performance alongside tape metrics confirms genuine strength gains.