
The Distorted Scale Trap
A raw scale display causes endless health tracking frustration. You stare down at a single morning weight number. That isolated number fails to reflect your physical stature. In my coaching experience, raw scale weight deceives people. When I evaluate patient weight profiles at the clinic, patterns emerge. Single weight numbers ignore total skeletal frame dimensions completely. Two individuals can weigh exactly two hundred pounds each. A person standing six feet tall handles that weight easily. A person standing five feet tall carries severe structural strain.
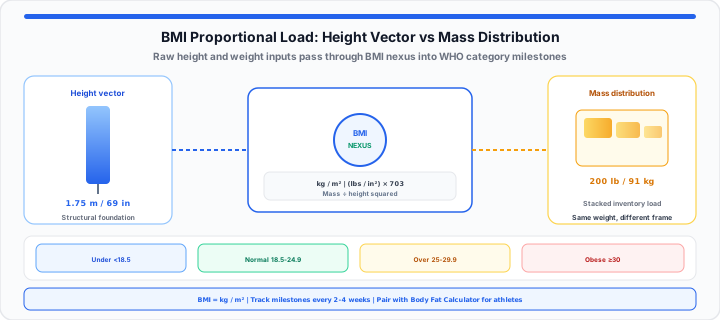
Think of your BMI as a primary sizing gauge. It is a quick mathematical filter scanning physical proportions. Compare your skeletal frame to a retail shelving unit. Your height dictates structural size and steel shelf beams. Your total weight represents inventory boxes stacked on top. BMI runs a quick visual warehouse audit on load-bearing capacities. It checks if stacked box volume matches frame strength. It does not inspect specific items inside those boxes.
To get started, run your height and weight through our BMI Calculator, then compare your score against the Healthy Weight Calculator range for your stature.
The Mass-to-Stature Baseline
Evaluate your vertical stature against total mass first. Height establishes the structural foundation for body mass distribution. Taller frames distribute total body weight across larger surface areas. Shorter frames compress identical weight volumes into smaller physical areas. In our fitness testing, unadjusted weight numbers create misleading conclusions. Proportional sizing requires adjusting total mass relative to height. The mass-to-stature baseline normalizes body mass across different heights. Physiologists use this calculation to establish baseline metabolic risk.
BMI = Mass in kg ÷ (Height in Meters)²
Imperial BMI = (Weight in lbs ÷ (Height in Inches)²) × 703
Simulate your personal proportion metrics with our BMI Calculator. Verify baseline metabolic dimensions instantly before starting new regimens. If you record weight in pounds and need kilograms, use the Pounds to Kg Converter first.
Height Scaling Limits
Height measurements require extreme precision during baseline clinical audits. Small height errors alter final body mass index calculations significantly. A half-inch discrepancy shifts calculated body mass index outcomes. Measure your standing height against a flat wall surface. Remove shoes and thick socks before recording height metrics. Keep your head level and posture straight during measurements. Press your heels flat against the floor border line. Record height to the nearest quarter of an inch. Precise height inputs protect your long-term metabolic tracking data.
Unit Conversion Thresholds
Converting imperial units to metric values requires precise multiplication factors. Multiply weight in pounds by zero point four five three to yield kilograms. Multiply height in inches by zero point zero two five four to yield meters. Square your height in meters before dividing total kilograms. The squaring factor accounts for three-dimensional body volume expansion. Human mass expands exponentially as vertical height increases linearly. Automated calculation tools eliminate manual unit conversion errors entirely.
| BMI Classification | Numeric Range | Sedentary Population Clinical Interpretation | Bodybuilder Population Clinical Interpretation |
|---|---|---|---|
| Underweight | Below 18.5 | Indicates potential nutritional deficits or muscle wasting. | Rare condition requiring immediate nutritional and strength support. |
| Normal Weight | 18.5 – 24.9 | Reflects optimal physiological proportion and low chronic risk. | Represents low body fat with moderate lean muscle mass. |
| Overweight | 25.0 – 29.9 | Suggests excess adiposity accumulating around visceral organs. | Frequently reflects dense skeletal muscle mass rather than fat. |
| Obese (Class I+) | 30.0 or Higher | Signals elevated risk for metabolic syndrome and cardiovascular stress. | Requires body fat percentage audits to confirm true risk. |
The Threshold Category Spectrum
Moving onto category thresholds, raw numbers require structured clinical context. Standardized category spectrums map calculated scores into biological zones. World Health Organization parameters define universal weight category boundaries. These boundaries categorize individuals into four primary physiological zones. In our clinical evaluations, tracking progress across boundaries provides clarity. Crossing a category border marks a tangible physical health milestone. Tracking milestone progress keeps patients motivated during long transformations. Small downward shifts in score yield major cardiovascular health benefits.
Map out your weight milestones using our BMI Calculator. Test custom physical activity adjustments across target weight ranges. For deeper context on what each bracket means day to day, read Understanding BMI for Adults: What Your Score Really Means. Graph monthly BMI readings over time with the Line Graph Maker — see our guide on tracking client weight loss transformations.
Metabolic Risk Boundaries
Category spectrums correlate directly with statistical chronic disease risks. Scores below eighteen point five signal potential lean tissue depletion. Depleted lean tissue compromises immune system function over time. Underweight status increases osteoporosis and bone fracture vulnerability risks. The normal range shows minimal risk for metabolic complications from eighteen point five to twenty-four point nine. Individuals in this zone demonstrate superior glucose tolerance markers. Values between twenty-five and twenty-nine point nine indicate overweight status with mild elevation in systemic inflammatory markers. Scores above thirty signal elevated risk for cardiovascular stress and higher incidences of type two diabetes. Monitoring boundary transitions helps doctors deliver timely preventative care.
The Real-World Body Composition Adjustment
In practical environments, high-performance athletes require secondary composition audits. Standard body mass index calculations cannot distinguish muscle from fat. Dense skeletal muscle tissue weighs significantly more than adipose tissue. A heavily muscled weightlifter often registers an elevated score that falsely indicates overweight or obese status. In my coaching experience, athletic populations need secondary metrics. A powerlifter may carry low body fat despite high scale weight. Evaluating skinfold thickness isolates true subcutaneous fat storage accurately. Waist circumference measurements clarify true abdominal fat distribution. Bioelectrical impedance testing isolates true body fat percentage values. Combining these diagnostics prevents false clinical obesity misdiagnoses.
Athletes must evaluate several body composition properties during audits:
- Dense Muscle Tissue Offset: Heavy lean muscle increases total weight without adding fat.
- Waist-to-Height Ratio Evaluation: Waist perimeter should measure less than half your standing height.
- Visceral Fat Risk Isolation: Abdominal fat surrounding internal organs poses primary metabolic risks.
- Hydration Level Fluctuations: Temporary water retention skews daily scale weight readings slightly.
- Bone Density Variations: Dense skeletal frames add non-fat mass to baseline calculations.
- Subcutaneous Adipose Audits: Skinfold calipers measure fat layers beneath skin directly.
- Metabolic Rate Alignments: High muscle mass increases resting daily energy expenditure — verify on the BMR Calculator.
- Multi-Metric Tracking Logs: Combine body mass index with waist measurements and the Body Fat Calculator for precision.
Simulate custom physical proportions with our BMI Calculator, then cross-check target ranges on the Ideal Weight Calculator and Lean Body Mass Calculator. For body fat methodology details, see our body fat percentage beginner's guide.
Open BMI Calculator Open Body Fat Calculator
Frequently Asked Questions
How do you calculate your body mass index manually?
Divide your total weight in kilograms by height in meters squared. For imperial metrics, multiply pounds by 703 over inches squared. This mathematical calculation yields your precise body mass index score.
Why can an online BMI calculator sometimes overestimate body fat in bodybuilders?
Body mass index calculations measure total body weight only. The formula cannot differentiate lean skeletal muscle from body fat. Muscular athletes possess high mass without carrying excess body fat. This structural limitation causes high muscle mass to skew scores higher.
What is a healthy body mass index range for adults?
Normal readings span between eighteen point five and twenty-four point nine. This category reflects optimal health outcomes for most adult populations. It indicates low statistical risk for chronic cardiovascular conditions. Maintaining this range supports overall longevity and metabolic efficiency.
How often should you track your weight milestones using BMI?
Check your calculated score once every two to four weeks. Daily tracking captures temporary water weight fluctuations rather than fat. Monthly monitoring reveals true structural composition trends over time. Consistent monthly logs help you evaluate long-term wellness progress accurately.