
The Tracker Inflation Illusion
You finish an intense forty-five minute gym session. Your smartwatch screen displays a massive seven hundred calorie burn. Yet your scale weight refuses to budge an inch. You feel completely exhausted and deeply frustrated by stalled progress. In my training experience, fitness trackers inflate active energy numbers. When I evaluate daily energy expenditure tracking, algorithms overcount movement. Trackers confuse resting cellular costs with active movement exertion.
Smartwatch optical sensors measure wrist blood flow variations continuously. Algorithms estimate oxygen consumption by mapping pulse rates to formulas. Systemic heat buildup tricks wrist sensors into overestimating energy expenditure. Caloric calculations require adjusting for individual physiological differences carefully. Think of your daily calorie burn as a dynamic fuel meter. It is a strict physical budget shifting with movement choices. Compare your metabolic system to a commercial delivery truck. Your resting metabolism resembles a truck engine idling in park. The idling engine burns baseline fuel to power dashboard electronics. Stepping out into a daily walk slams the accelerator pedal. Heavy acceleration forces fuel injectors to pump immense fuel volumes.
To get started, examine your fundamental basal metabolic requirements first. For a deeper look at wrist tracker error rates, see our guide on why smartwatches overestimate daily calories burned.
The Resting Metabolic Floor
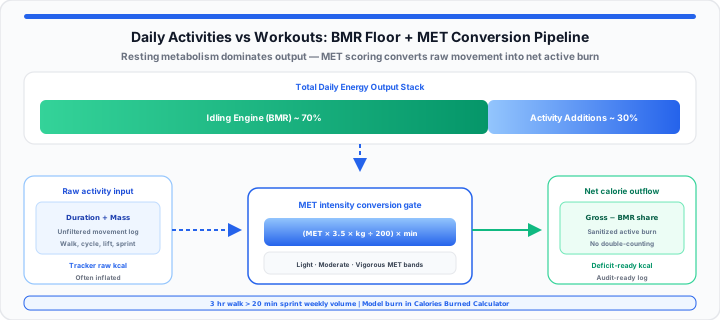
To get started, evaluate your static baseline energy expenditure floor. Basal metabolic rate dictates your absolute baseline cellular survival costs. Organ systems consume constant energy while resting in total stillness. Brain activity and cardiac contraction demand steady glucose and oxygen. Your liver consumes massive energy filtering blood around the clock. In our metabolic cart testing, resting costs dominate total burn. Idling metabolic output accounts for most daily calorie expenditure. Passive daily movement adds smaller burn blocks above resting levels.
Basal metabolic rate formulas estimate baseline energy needs mathematically. The Mifflin-St Jeor equation calculates resting daily calorie expenditure. Body surface area influences cellular heat dissipation into surrounding air. Thyroid hormone levels regulate baseline cellular metabolism across all tissues. Simulate your movement metrics with our interactive Calories Burned Calculator. Verify your baseline energy expenditure instantly with the BMR Calculator before building fitness plans.
Oxygen Consumption Limits
Oxygen consumption establishes your true cellular energy turnover capacity. Human cells require oxygen to break down fats and carbohydrates. One liter of consumed oxygen burns roughly five total calories. Resting human tissue consumes three point five milliliters per kilogram. This baseline oxygen rate represents one standard metabolic equivalent task. Cardiovascular health limits maximum oxygen delivery during intense exercise. Tracking oxygen thresholds prevents overestimating total calorie expenditure accurately.
Muscle Tissue Mass Multipliers
Lean muscle mass increases baseline daily resting metabolic rates significantly. Muscle tissue requires far more idling fuel than adipose tissue. One pound of muscle burns six calories daily at rest. One pound of fat burns only two calories daily at rest. Resistance training builds dense lean mass to lift idling metabolism. Higher muscle mass accelerates passive daily calorie burn effortlessly. Mitochondrial density inside muscle cells determines resting energy conversion rates. Cross-check composition assumptions with the Body Fat Calculator when your resting burn looks off.
Baseline First: Lock in your true resting burn with the BMR Calculator, then stack activity on top using the TDEE Calculator — not raw watch totals.
The Convective MET Coefficient Matrix
Moving onto exercise mechanics, physical activities require standardized comparison scales. Metabolic Equivalent of Task values measure movement intensity accurately. A single MET represents energy burned sitting quietly in stillness. An activity rated at four METs burns four times baseline. Walking briskly across flat ground registers three point five METs. High intensity interval training reaches up to eleven MET values. In my coaching experience, MET scoring prevents energy tracking errors. The Compendium of Physical Activities classifies hundreds of human movements.
Walking velocity changes MET intensity values dramatically across speed ranges. Walking at four miles per hour requires elevated oxygen consumption. Cycling wind resistance increases energy expenditure at higher road speeds. Steep uphill terrain inclines multiply mechanical energy demands significantly. Map out your real energetic ceiling using our free Calories Burned Calculator. Test your custom physical activity adjustments across various exercise durations.
Calories Burned = (MET × 3.5 × Weight in kg ÷ 200) × Duration in Minutes
Adjusted Active Burn = Total Caloric Outflow − Idling BMR Allocation
Task Intensity Scales
Task intensity scales categorize movement from light rest to maximal effort. Light activities remain below three total MET unit thresholds easily. Casual house cleaning and slow walking consume minimal active fuel. Moderate activities span between three and six standard MET units. Brisk walking and leisurely cycling fall into moderate expenditure zones. Vigorous activities exceed six MET units during sustained exertion. Sprinting and heavy weightlifting demand peak oxidative energy delivery.
Continuous Heart Rate Zones
Heart rate metrics reveal real-time cardiovascular strain during workouts. Elevated heart rates indicate higher relative oxygen consumption demands. Zone two training optimizes fat oxidation during long cardio sessions. Zone four exertion relies primarily on glycogen fuel stores. Wearable sensors estimate calories by monitoring continuous pulse shifts. Cardiovascular fatigue can inflate heart rate without increasing work. Dehydration causes elevated heart rates called cardiac drift in heat. Model training zones with the Target Heart Rate Calculator and pace targets with the Pace Calculator.
| Activity Description | Standard MET Value | Avg. Calories / 30 Min (70 kg) | Long-Term Deficit Success |
|---|---|---|---|
| Slow Walking (2 mph) | 2.0 | 70 Calories | Moderate: Easy to sustain daily without fatigue. |
| Brisk Walking (3.5 mph) | 3.8 | 133 Calories | High: Excellent low-stress daily calorie burner. |
| Light Leisure Cycling | 4.0 | 140 Calories | Moderate: Sustainable commute options build momentum. |
| Heavy Weightlifting | 6.0 | 210 Calories | High: Preserves lean muscle mass to boost BMR. |
| Vigorous Running (6 mph) | 9.8 | 343 Calories | High: Rapid burn but requires recovery management. |
| HIIT Interval Sprints | 11.0 | 385 Calories | Moderate: High acute burn but limited total duration. |
Cross-Check Workouts: Compare wrist-reported burn against MET-based estimates in the Calories Burned Calculator. For full intake targets, use the Calorie Calculator instead of eating back raw watch numbers.
The Production Energy Outflow Protocol
In practical environments, balancing commutes against workouts optimizes fat loss. Casual movement generates high total weekly energy expenditure without fatigue. Non-exercise activity thermogenesis accounts for significant daily burn variation. A two-hour walking commute burns substantial calories across entire weeks. Intense interval sessions burn high calories in short timeframes. Explosive workouts trigger excess post-exercise oxygen consumption recovery demands. Heavy workouts create metabolic fatigue if performed without adequate recovery. Combining daily walking with structured workouts creates sustainable metabolic momentum.
Excess post-exercise oxygen consumption elevates metabolic rates after sprinting. High cortisol levels from overtraining hamper long-term body fat loss. Reaching ten thousand daily steps ensures substantial non-exercise burn totals.
Activity Expenditure Benchmarks
Fitness coordinators evaluate several key energy output properties during planning:
- Continuous Low-Stress Movement: Daily walking increases caloric deficit without triggering hunger spikes.
- Post-Exercise Oxygen Recovery: High intensity workouts elevate metabolic burn for hours post-exercise.
- Total Mechanical Work Volume: Moving heavy loads across distances determines total physical work.
- Systemic Fatigue Accumulation: Excessive intense cardio increases cortisol and hampers muscular recovery.
- Weekly Expenditure Compounding: Small daily activity additions accumulate massive monthly energy deficits.
- Substrate Utilization Shifts: Low intensity activities burn higher percentages of body fat.
- Glycogen Depletion Dynamics: Intense interval training rapidly drains stored muscular glycogen reserves.
- Adaptive Thermogenesis Buffers: Prolonged calorie deficits cause bodies to decrease spontaneous movement.
Simulate your movement metrics with our interactive Calories Burned Calculator. Eliminate progress confusion across all your workout and activity logs. Keep your long-term fat loss goals fully aligned with metabolic reality. For a full deficit walkthrough, see our Calorie Calculator weight loss guide.
Open Calories Burned Calculator Open BMR Calculator
Frequently Asked Questions
How do you calculate calories burned using MET values?
Multiply the activity MET value by three point five. Multiply that result by your body weight in kilograms. Divide the final number by two hundred for minute rates. Multiply by total activity duration minutes for total calories burned.
Why do different daily activities burn more energy than short intense workouts?
Daily activities accumulate hours of low-intensity movement over time. Long duration offsets lower metabolic intensity coefficients very effectively. A three-hour walk often exceeds a twenty-minute sprint session. Sustained activity volume yields greater total weekly caloric expenditure.
What is the difference between gross and net calories burned?
Gross calories include your baseline idling resting metabolic burn. Net calories subtract baseline resting costs from total expenditure. Tracking net calories prevents double-counting basal burn during workouts. Net energy figures provide accurate active expenditure numbers for tracking.
How does body weight affect total calories burned during walking or cycling?
Moving heavier body mass requires greater mechanical force production output. Heavier individuals consume more oxygen during identical physical activities. Higher oxygen consumption drives elevated total caloric energy burn. Weight reductions slightly decrease active calorie expenditure for identical tasks.