
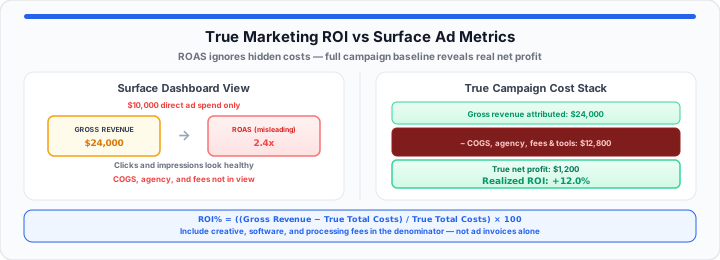
There is a distinct, sickening feeling every founder knows: watching thousands of dollars leave your corporate bank account toward paid social or search ads while your inventory sits completely frozen on warehouse shelves. Your marketing agency hands over a quarterly deck covered in green trendlines, touting hundreds of thousands of impressions and thousands of link clicks. Yet when you check your cash balance at the end of the month, there is no money left over to pay down inventory debt or reinvest in product development.
To understand why this happens, think of your raw marketing budget like throwing handfuls of premium seed into a backyard vegetable garden patch. If you scatter $500 worth of exotic seeds across the soil but your final harvest yields only a single basket of tomatoes worth $100 at the local market, your garden did not expand your wealth—it drained your resources. Learning how to calculate return on investment is simply building a mathematical scale to measure how much food actually grew compared to the total weight of the gold you handed over for the seeds. Master the business ROI formula, and you can instantly spot which ad channels are feeding your bottom line and which ones are secretly bleeding your operation dry. You can verify campaign payback with the ROI Calculator once your true cost baseline is assembled.
The Vanity Trap: Why Clicks and Impressions Hide Financial Bleeding
In my experience mapping ad spend variables across early-stage e-commerce brands and B2B software ventures, the most dangerous metrics are always the loudest ones. Ad platforms are built to highlight top-of-funnel activity: impressions, click-through rates (CTR), video views, and cost-per-click (CPC).
When I’m auditing client profit margins, I frequently find growth teams celebrating a 4% click-through rate on a social ad campaign that is actively losing $15 on every single customer order. Why? Because platform dashboards track immediate user interactions while remaining completely blind to your cost of goods sold (COGS), payment processing cuts, shipping subsidies, and agency retainers. High traffic volume paired with negative unit economics is simply accelerated corporate cash drain. If your conversion yields drop below your operational break-even point, scaling up your ad spend does not build brand equity; it simply accelerates your burn rate. Cross-check unit economics with the Margin Calculator and retail COGS rules in our guide on percentage increases and margins for retail pricing.
Isolating the Variables: What Counts as a True Marketing Cost?
When evaluating marketing returns, most founders make the operational mistake of evaluating raw ad spend in isolation—looking strictly at the direct invoice paid to search or social ad auctions. This creates a false sense of profitability. To calculate your true return baseline, every single dollar required to deploy and support that campaign must be aggregated into your cost denominator.
In our campaign split-testing audits, we categorize total campaign expenses into three non-negotiable operational buckets:
- Direct Platform Spend: The raw budget billed by ad platforms to serve your creative placements across search feeds or social networks.
- Creative Asset & Production Overhead: Compensation paid to freelance graphic designers, video editors, copywriters, or specialized agencies, alongside product gifting costs for creator-led video content.
- Software Infrastructure & Transaction Fees: Monthly software subscriptions tied directly to conversion tracking (attribution software, dedicated landing page hosts, email automation flows) combined with merchant payment processing cuts (typically 2.9% + $0.30 per transaction).
If you commit $5,000 to social ad auctions but spend $2,000 on video editing, $500 on custom landing page software, and pay $1,500 in merchant processing fees to collect customer payments, your baseline cost is $9,000—not $5,000. Model rep and agency cuts alongside ads using the Commission Calculator and sales commission overhead guide.
Step-by-Step: Working the Classical Business ROI Formula
To isolate your true net return without getting tripped up by hidden campaign expenses, follow this standard procedural audit workflow:
- Calculate Gross Revenue Attributed: Sum all top-line cash collected directly from customers originating from the specific campaign within your target tracking window.
- Determine True Total Costs: Add your direct ad spend, creative fees, software tooling, merchant processing fees, and product delivery costs together into a single master baseline figure.
- Isolate Campaign Net Profit: Subtract your True Total Costs from your Gross Revenue Attributed (Net Profit = Gross Revenue − Total Campaign Costs).
- Execute Division and Scaling: Divide your Net Profit by your True Total Costs, then multiply the resulting decimal by 100 to convert the figure into a standard percentage.
Expressed cleanly, the core equation operates as:
ROI % = ((Gross Campaign Revenue − True Total Campaign Costs) ÷ True Total Campaign Costs) × 100
To avoid manually wrestling with nested net-margin variables on a scratchpad or running the risk of simple decimal slips while presenting your quarterly data to investors, you can drop your raw campaign expenses directly into our interactive ROI Calculator to map your financial performance instantly. Use the Percentage Calculator to sanity-check ratio conversions, and roll channel totals into the Budget Calculator for quarterly planning.
Factoring in Long-Tail Yields: Customer Lifetime Value
In practical environments—especially within subscription commerce or enterprise software—evaluating a campaign solely on its immediate 30-day cash return can lead you to shut down highly lucrative acquisition channels prematurely.
When an initial campaign operates at a zero net profit break-even point on Day 1, it may look like an inefficient use of capital on an income statement. However, if your business model retains customers over a 12-month window with predictable recurring billing, your initial acquisition outlay unlocks a multi-year cash stream. In these recurring growth models, adjust your calculation baseline by replacing single-transaction gross revenue with 12-Month Realized Customer Lifetime Value (LTV). Just ensure you discount your long-tail projections to account for monthly customer churn and ongoing support overhead, keeping your long-term yield projections grounded in verifiable bank deposits.
The Growth Ops Performance Matrix: Comparing Channels
To evaluate how different acquisition strategies hold up once true costs are isolated, review the comparative audit matrix below. This table contrasts three common digital campaign structures across identical 30-day tracking windows:
| Acquisition Channel | Direct Ad Spend | Creative & Operational Overhead | Gross Revenue Generated | True Net Profit | Realized ROI % |
|---|---|---|---|---|---|
| Low-Margin Social Ads (paid social push) | $10,000 | $3,500 (UGCs + Editing + Tools) | $18,000 | $4,500 | +33.3% |
| High-Intent Search Ads (search terms) | $8,000 | $1,200 (Landing Page + Copy) | $23,000 | $13,800 | +150.0% |
| Premium Influencer Partnerships (sponsorship) | $12,000 | $4,000 (Agency Fee + Product Gifting) | $14,000 | −$2,000 | −12.5% |
Notice how the social ad channel, despite generating a respectable $18,000 in gross sales, yielded a modest 33.3% return once overhead was factored in. Meanwhile, high-intent search ads delivered four times the return efficiency due to lower creative production overhead and stronger buyer intent. Before scaling email or lifecycle campaigns, clean list hygiene with our guide on removing duplicate email entries from marketing lists.
Open ROI Calculator Open Margin Calculator
Frequently Asked Questions
What is a universally acceptable or healthy ROI percentage for a digital marketing campaign?
In most e-commerce and digital growth environments, a healthy campaign benchmark is a 5:1 gross revenue-to-ad-spend ratio. However, after isolating product costs, creative fees, software tools, and merchant processing, a true net campaign ROI between +100% and +150% is considered highly sustainable for scaling businesses.
How do you accurately calculate return on investment if you sell a multi-month subscription product?
For subscription business models, replace immediate 30-day gross revenue with your projected 6-month or 12-month net LTV minus customer retention costs. Divide this cumulative net lifetime margin by your upfront total customer acquisition cost (CAC) including creative overhead, then multiply by 100 to evaluate capital payback efficiency.
What is the core difference between measuring ROI versus measuring ROAS (Return on Ad Spend)?
ROAS measures top-line gross revenue generated per dollar spent strictly on direct ad auctions (ROAS = Revenue ÷ Direct Ad Spend). It completely ignores product costs, agency retainers, software tools, and operational overhead. Conversely, ROI measures true bottom-line profitability by accounting for all hidden production and operational expenses (ROI % = ((Gross Revenue − Total Costs) ÷ Total Costs) × 100).