
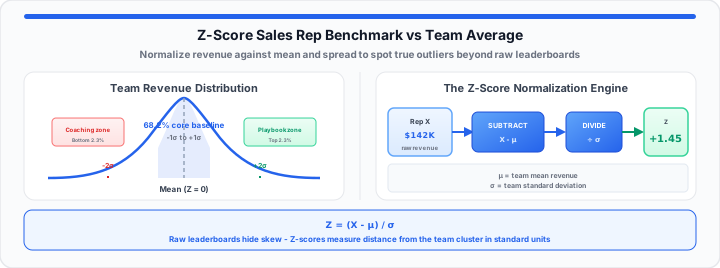
Stacked revenue leaderboards create dangerous illusions in sales operations. A sales representative who lands an unforecasted, multi-million dollar enterprise deal off an inbound lead looks like an undisputed top performer, while a steady representative who reliably closes fifteen mid-market opportunities sits in the middle of the board. Raw revenue figures reward luck and territory bias just as often as operational skill.
When I’m evaluating quarterly revenue pipelines, relying strictly on sum totals obscures true operational capability. To spot who is actually outperforming expectations and who is riding the coattails of a skewed dataset, you need standard deviation. Think of standard deviation as the typical splash radius around a dartboard’s bullseye. It measures the normal, expected spread of your team’s results. A Z-score tells you exactly where an individual rep’s throw landed relative to that normal cluster—instantly distinguishing a tight, reliable pattern from a wild throw that missed the wall entirely or an accidental double-bullseye. If you need team spread first, start with the Standard Deviation Calculator or the standard deviation in 60 seconds guide.
Moving Past Raw Averages: The Statistical Flaw in Sales Tracking
Arithmetic averages fail the moment dataset variance widens. If eight sales reps generate $50,000 each, one generates $40,000, and one mega-account manager pulls in $500,000, the team mean jumps to $94,000. Under traditional stack-ranking, nine out of ten reps suddenly appear to underperform relative to the average, even though ninety percent of the team operated within a tight, healthy revenue cluster.
This statistical distortion is known as positive skew. In sales organizations, positive skew hides mid-tier consistency and penalizes reps working in smaller territories or challenging market segments. Standardizing performance metrics through statistical normalization eliminates this baseline bias.
By converting raw numbers into standard deviation units, you measure relative positioning rather than gross volume alone. A representative’s score reflects how many standard deviation units their performance lies above or below the team mean. This levels the playing field across varying deal sizes, account tiers, and territory potential. For commission and margin context on whether payouts match net contribution, see how founders calculate real sales commission overhead.
Step-by-Step: The Formula for Normalizing Your Sales Roster
To get started normalizing your revenue figures, execute this five-step statistical workflow across your team’s raw performance data:
- Determine the Team Mean (μ): Calculate the simple arithmetic average by adding all individual sales totals together and dividing that sum by the total number of representatives evaluated. The Average Calculator handles this baseline in one pass.
- Calculate Individual Deviations from the Mean: Subtract the calculated team mean from every individual representative’s actual sales volume (X − μ). A negative result indicates performance below team average.
- Square Every Deviation and Sum the Total: Square each individual deviation value to eliminate negative signs, then sum those squared figures together across the entire sales roster.
- Compute Team Standard Deviation (σ): Divide the sum of squared deviations by the total number of reps (population) or by n − 1 (sample), then calculate the square root of that quotient. This provides your team’s variance baseline. Use the Statistics Calculator when you want mean, spread, and quartiles from a pasted roster list.
- Calculate the Individual Z-Score (Z): Divide an individual representative’s specific deviation from the mean by the team standard deviation using the core formula Z = (X − μ) / σ.
The Quick Reference Performance Bracket
Moving onto performance interpretation, map your calculated Z-scores against standard statistical distribution brackets to classify representative output objectively:
| Z-Score Range | Performance Classification | Expected Team Distribution | Recommended Operational Action |
|---|---|---|---|
| +2.00 and above | Exceptional Outlier | Top 2.3% of team | Document sales playbook; analyze deal scalability |
| +1.00 to +1.99 | High Performer | 13.6% of team | Fast-track for enterprise accounts; evaluate for leadership |
| −0.99 to +0.99 | Expected Baseline Core | 68.2% of team | Focus on incremental skill upgrades; maintain deal velocity |
| −1.00 to −1.99 | Below Baseline | 13.6% of team | Initiate targeted pipeline coaching; review lead routing |
| −2.00 and below | Severe Negative Outlier | Bottom 2.3% of team | Implement Performance Improvement Plan (PIP); audit activity levels |
Practical Sales Ops Workflows: Rewarding Consistency over Fluke Wins
In practical environments, statistical normalization transforms how sales operations leaders establish quotas, allocate territories, and structure quarterly compensation tiers.
In my sales reviews, I use Z-score distribution models to separate operational skill from random market volatility. When a rep hits a +2.5 Z-score solely because a legacy enterprise client unexpectedly expanded their contract, normalization highlights that the victory was an anomaly rather than a repeatable process. Conversely, if a rep maintains a steady +1.2 Z-score month after month across competitive SMB accounts, the data proves high operational efficiency that warrants promotion or quota expansion.
In our testing of performance distribution patterns across scaling sales teams, tracking normalized trends over consecutive quarters exposes pipeline decay far earlier than raw quota achievement metrics. A sales representative might meet their absolute quota while their relative Z-score trends downward from +1.8 to +0.2 over three quarters. This drop indicates that while the individual is still closing deals, the rest of the team is accelerating faster, or market conditions are expanding while the rep’s relative market share shrinks.
Normalizing performance data also protects teams from quota panic during seasonal down cycles. When overall market demand drops across an entire industry vertical, absolute revenue figures drop for everyone. Raw reporting makes every representative look like an underperformer. Z-scores reveal who maintained strong relative performance under adverse conditions, ensuring your top talent remains recognized and retained even during broader economic contractions.
Instead of manually tracking nested square root formulas inside an over-engineered spreadsheet or guessing who your true stable performers are, drop your raw pipeline metrics directly into our interactive Z-Score Calculator to map team performance instantly once you have μ and σ from the roster. For LLM batch consistency using similar deviation thinking, see generative AI prompt accuracy deviation models.
Open Z-Score Calculator Open Standard Deviation Calculator
Frequently Asked Questions
What does a negative Z-score indicate about a sales representative’s output?
A negative Z-score indicates that a sales representative’s performance metric falls below the calculated team average. For example, a score of −1.5 means the representative produced 1.5 standard deviations less revenue or pipeline activity than the average rep on the team during that measurement period.
How does a single massive enterprise deal skew the overall team standard deviation?
A single massive deal dramatically inflates both the team mean and the standard deviation calculation. This artificial expansion stretches the baseline curve, pulling down the relative Z-scores of solid mid-market reps and making healthy performance appear below average. Data analysts often run secondary evaluations excluding extreme single-deal anomalies to verify core baseline performance.
Can you use Z-scores effectively if your sales team has fewer than ten people?
While Z-scores can technically be calculated for small groups, statistical reliability improves with sample sizes of fifteen or more reps. On very small teams, individual variance swings the standard deviation too violently. For teams under ten reps, use sample standard deviation formulas and evaluate rolling six-month averages rather than single-month snapshots.
What is the difference between a sample Z-score and a population Z-score in sales operations?
A population Z-score assesses your entire active sales force as a complete system using the total count in the denominator. A sample Z-score subtracts one from the rep count denominator to adjust for potential sampling bias when evaluating a small subset of representatives across a multi-region corporate network.