
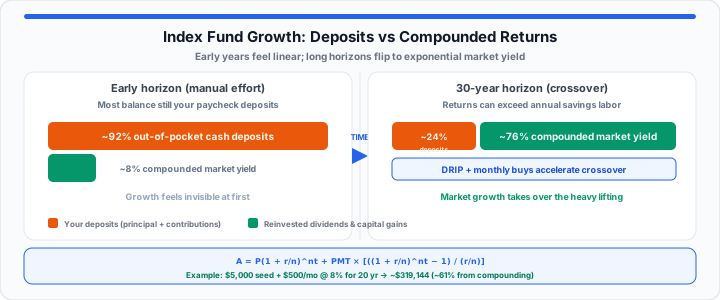
Opening your brokerage account after twelve full months of squeezing $200 out of your paycheck can feel surprisingly uninspiring. You check the total, see $2,480 sitting in your core broad-market fund, and realize that barely $80 came from actual market returns. When you are standing at the base of a 30-year financial goal, watching your balance crawl forward in double digits makes the entire process feel like an endless uphill battle.
In my experience tracking long-term market distributions, this initial slog is where most retail investors throw in the towel. They treat their portfolio like a standard savings bucket rather than an exponential system.
Think of early index fund deposits like planting a young banyan tree seedling in your yard. During the first few seasons, it looks like nothing more than a fragile twig that requires constant water and manual care. You are doing all the heavy lifting. As the seasons pass, however, its root structure reaches deep into the subsoil, and its upper branches send down auxiliary trunks that anchor directly into the ground. Eventually, those supporting trunks form a massive, self-sustaining canopy. Long after you stop carrying water buckets to the main base, the tree continues expanding on its own energy.
Understanding the math behind that transition from manual watering to self-generating canopy is the key to staying committed through the slow early years.
The Linear Savings Trap: Why Bare Cash Can’t Match Broad-Market Compounding
When I’m auditing historical fund sheets or running retirement stress testing for clients, the single biggest leak in personal wealth accumulation isn’t poor stock selection—it’s reliance on linear cash accumulation.
Savings accounts and fixed-rate notes pay interest only on your principal base or lock your yield into a static line. If you stack $500 a month inside a traditional bank vault, your wealth moves in a rigid, straight line. After 20 years, your total pile is simply your manual labor multiplied by time, leaving your purchasing power completely exposed to persistent monetary inflation.
Linear Growth (Cash): Total = Principal + (Principal × Rate × Time)
Compounded Equity Growth: Total = Principal × (1 + Rate)Time + Monthly Contribution Series
Broad-market index funds operate on an entirely different economic engine. When you buy a low-cost ticker tracking the S&P 500 or Total Stock Market index, you are buying fractional ownership in hundreds of profitable businesses. Those companies generate real earnings, reinvest capital to grow operations, and distribute cash dividends.
When those underlying earnings compound and get plowed back into purchasing additional index fund shares, your money starts earning money on the money your money previously earned. Equity accumulation acts as an active, inflation-resilient shield because corporate revenues naturally adjust to rising price levels over extended horizons.
Long-term index fund wealth shifts from personal savings effort to exponential market growth. For a deeper primer on the snowball mechanics, see Compound Interest Explained Simply.
Step-by-Step: The Investor’s Method for Manual Interest Calculations
To accurately model your portfolio trajectory, you need to combine two distinct financial math formulas: the future value of your starting principal sum and the future value of your recurring monthly contribution series.
When clients ask me how to calculate compound interest monthly investment returns without relying on black-box software, we walk through this exact four-step breakdown:
- Isolate Starting Principal (P): Record the exact liquid dollar amount currently sitting inside your index fund shares.
- Determine Monthly Interest Conversion (r and n): Take your assumed annual market return rate (historically 7% to 8% for broad US indexes after adjusting for long-term inflation) and divide it by 12 to establish your monthly compounding yield decimal.
- Establish Total Investment Horizon (t): Multiply your target investment duration in years by 12 to establish the absolute number of compounding intervals (n × t).
- Combine Future Value Equations: Calculate the expansion of your original lump sum alongside the accumulated series of monthly deposits (PMT).
The complete mathematical formula for a dollar-cost-averaging index fund investor looks like this:
A = P(1 + r ÷ n)nt + PMT × [((1 + r ÷ n)nt − 1) ÷ (r ÷ n)]
Where:
- A = Final total portfolio balance
- P = Initial principal balance
- PMT = Monthly contribution amount
- r = Annual nominal interest rate (in decimal form, e.g., 0.08 for 8%)
- n = Compounding periods per year (12 for monthly reinvestment)
- t = Total investment horizon in years
To see this in action on a practical level, let’s look at a concrete scenario: starting with $5,000 in an index fund, contributing $500 per month, assuming an 8% annual return, compounded monthly over 20 years:
- Monthly interest rate (r ÷ n) = 0.08 ÷ 12 = 0.006667
- Total compounding periods (nt) = 12 × 20 = 240 months
- Growth of initial $5,000 principal: $5,000 × (1 + 0.006667)240 = $24,634
- Growth of $500 monthly contributions: $500 × [((1 + 0.006667)240 − 1) ÷ 0.006667] = $294,510
- Total portfolio value (A) = $24,634 + $294,510 = $319,144
Out of that $319,144 total balance, your actual cash out-of-pocket deposits equaled $125,000 ($5,000 + $120,000 in contributions). The remaining $194,144 is pure, compounded market return. Cross-check the same inputs on our Compound Interest Calculator or map cash-flow timing with the Investment Calculator.
The Power of Dividend Reinvestment: Turning on the Auto-Pilot Switch
In practical environments, manual cash deposits are only one half of the growth equation. Modern brokerage accounts allow you to enable an automatic Dividend Reinvestment Plan (DRIP).
When companies within your index fund issue quarterly dividend payouts, a DRIP system immediately redirects that cash to buy fractional shares of the index fund on your behalf. You are essentially taking the cash profits generated by your auxiliary trunks and turning them right back into new saplings.
Enabling DRIP compresses the timeline required to reach your portfolio cross-over point—the moment where annual investment returns outpace your yearly out-of-pocket savings contributions—by anywhere from 3 to 7 full years. For a decade-focused walkthrough with DRIP tables, see How to Calculate Index Fund Compound Interest Over 10 Years.
To map your personal financial independence timeline without decimal slips on a scratchpad, drop your target savings metrics into our interactive Compound Interest Calculator or stress-test contribution step-ups with the Future Value Calculator.
The 30-Year Wealth Generation Matrix: Piling Up the Snowball
To visualize how different savings strategies scale over long horizons, let’s examine three standard monthly contribution profiles: a conservative $100 monthly budget, a steady $500 mid-tier allocation, and an aggressive $1,000 corporate-match track.
The matrix below assumes a starting principal of $1,000, an 8% nominal annual return baseline, and monthly compounding with dividend reinvestment enabled:
| Monthly Deposit Profile | Investment Horizon | Total Cash Outlay (Principal + Deposits) | Total Index Fund Value | Net Compounded Growth Yield |
|---|---|---|---|---|
| $100 / month | 10 Years | $13,000 | $23,221 | + $10,221 |
| $100 / month | 20 Years | $25,000 | $63,829 | + $38,829 |
| $100 / month | 30 Years | $37,000 | $153,963 | + $116,963 |
| $500 / month | 10 Years | $61,000 | $96,400 | + $35,400 |
| $500 / month | 20 Years | $121,000 | $299,437 | + $178,437 |
| $500 / month | 30 Years | $181,000 | $750,107 | + $569,107 |
| $1,000 / month | 10 Years | $121,000 | $187,873 | + $66,873 |
| $1,000 / month | 20 Years | $241,000 | $593,947 | + $352,947 |
| $1,000 / month | 30 Years | $361,000 | $1,495,286 | + $1,134,286 |
Notice how time transforms the numbers in the final column. On a 30-year horizon at $1,000 per month, your net compounded growth ($1,134,286) is more than three times larger than the total cash you deposited out of your paycheck ($361,000). That exponential gap represents the true power of long-term compounding.
A comprehensive Investment Calculator lets you tweak variables like inflation adjustments, expense ratios, and annual contribution step-ups to match your exact financial plan. Pair long horizons with the 15-year index fund projection guide and the Retirement Savings Calculator Guide when you extend beyond wealth accumulation into drawdown planning.
Moving onto common technical hurdles, retail investors often run into calculation confusion when attempting to account for real-world variables like management fees and distribution timing. Model fee drag with the Mutual Fund Calculator and inflation-adjusted purchasing power with the Inflation Calculator.
Open Compound Interest Calculator Open Investment Calculator
Frequently Asked Questions
How do you calculate compound interest on a recurring monthly index fund investment?
To calculate compound interest on recurring monthly deposits, you must combine the future value of your starting balance with the future value of an annuity series. The complete formula is A = P(1 + r ÷ n)nt + PMT × [((1 + r ÷ n)nt − 1) ÷ (r ÷ n)], where PMT represents your monthly contribution, r is your annual rate, n is 12, and nt is the total number of months.
What is the difference between simple interest and compound interest when tracking index funds?
Simple interest calculates yield exclusively on your original principal deposit throughout the investment lifespan (Interest = Principal × Rate × Time). Compound interest calculates yield on your initial principal plus all accumulated interest and reinvested dividends from prior periods. Index funds grow through compound interest because earnings and dividends buy additional shares that produce future earnings. Compare both modes on the Interest Calculator.
How does the compounding frequency (monthly vs. annually) alter your overall wealth growth over time?
More frequent compounding intervals generate slightly higher overall yields because earned returns are added back into the principal base sooner. For example, a $10,000 investment at an 8% annual return compounded annually yields $46,610 over 20 years. That same investment compounded monthly yields $49,268—an extra $2,658 generated purely by shortening the interest distribution cycle.
What historical return percentage should I assume when modeling long-term index fund growth?
When modeling broad US equity funds (like S&P 500 or Total Stock Market trackers) over 15 to 30 years, an average nominal return of 8% to 10% is standard. To account for long-term purchasing power loss due to inflation, professional planners often use a real return rate of 6% to 7%.
How do expense ratios impact the long-term compound growth of an index fund?
An expense ratio is the annual management fee charged by the fund issuer, expressed as a percentage of your assets. While a 0.03% expense ratio on a low-cost index fund has a negligible impact, a 1.0% fee on an actively managed fund can erase upwards of $100,000+ in potential compounded returns over a 30-year horizon due to lost growth on the fee dollars themselves.