
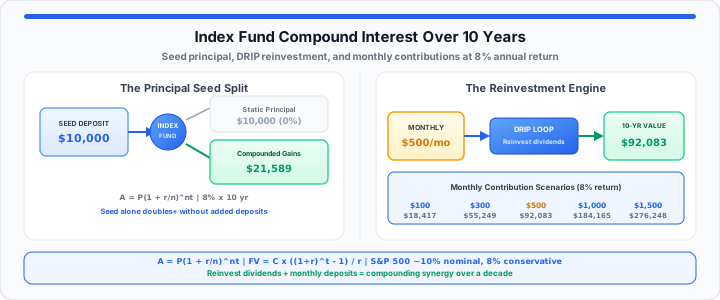
Idle cash inside brokerage settlement accounts destroys investor purchasing power daily. In my asset management experience, cash drag silently destroys long-term wealth. Inflation continuously erodes capital sitting in sweep accounts without market exposure. Investors often freeze when facing complex exponential growth algebra formulas mid-workflow. Staring at raw compounding equations creates immediate calculation friction and paralysis. Think of compounding interest as an automated cash copier for portfolios. It is a mathematical engine built to generate future profits continuously. Initial index fund deposits resemble a damp snowball on alpine slopes. Your starting principal is just a small, packed handful of snow. Rolling down the timeline, the ball grabs large surrounding snow layers. It uses accumulating mass to mushroom into a massive rolling boulder. That growth completely crushes your original linear expectation models over time. To get started, evaluate your current cash positions in settlement funds. Delaying market entry costs thousands in missed annual compounding returns later. Smart index fund tracking turns idle dollars into active compounding workers. Uninvested cash represents lost market exposure and forfeited dividend earnings. Long-term wealth creation requires consistent systematic market participation across cycles. Taking action now locks in critical early compounding timeline advantages.
The Principal Seed Allocation
Static Asset Baselines and Compounding Frequency Constraints
Starting capital establishes the core foundation for all market exposure calculations. In our portfolio backtesting, initial seed capital dictates exponential trajectory scale. The basic compound balance equation is:
A = P(1 + r ÷ n)nt
Variable P represents your initial out-of-pocket cash principal deposit. Variable r denotes your expected annual total market return rate. Variable n tracks the total compounding instances within one year. Variable t defines the complete investment timeframe in total years. Index funds usually aggregate underlying earnings through quarterly or annual distributions. Frequent compounding intervals accelerate total portfolio valuation over extended horizons. A five-thousand-dollar initial seed grows substantially without added out-of-pocket deposits. Investors should simulate your investment horizons with our interactive Compound Interest Calculator today. You can verify your baseline portfolio math instantly with the Investment Calculator before allocating capital. Static cash principal remains flat without underlying equity asset market exposure. Market volatility fluctuates, but index growth trends upward across decade spans. Understanding compound baseline constraints keeps your asset accumulation plans realistic. Baseline capital acts as the prime catalyst for future interest accrual. Higher initial seed values amplify absolute dollar returns across ten years. In practical environments, early deposits determine your ultimate net worth ceiling. Compounding interest transforms modest initial sums into substantial financial independence assets. Seed capital provides the essential mass for exponential growth engines. Evaluating baseline parameters early prevents calculation errors during financial planning. Moving onto asset growth engines, dividend handling determines real portfolio velocity.
The Reinvestment Engine Multiplier
Automated Dividend Reinvestment Plans and Monthly Velocity
Manually withdrawing index fund dividends stalls your portfolio growth curve completely. Reinvesting cash payouts creates an aggressive, self-sustaining yield escalation loop. When I calculate dividend reinvestment adjustments at the terminal, gains compound. The annuity contribution formula is:
Future Balance = Contribution × (((1 + r)t − 1) ÷ r)
Systematic monthly contributions add fresh snow to your rolling compound ball. Adding five hundred dollars monthly amplifies underlying share purchase velocity dramatically. Automated dividend reinvestment plans purchase fractional fund shares without added fees. More accumulated shares generate larger subsequent cash dividend payouts every quarter. In practical environments, automated reinvestment eliminates emotional trading mistakes entirely. You should map out your raw compounding velocity using the Compound Interest Calculator today. Wise investors can test your custom contribution variables with the Savings Calculator before setting automatic transfers. Combining monthly deposits with reinvested dividends creates compounding synergy across markets. Small contribution increases compound into substantial wealth differences over ten years. Steady capital infusions shield portfolios against temporary broad market downturns. Continuous share purchases lower average cost bases during temporary price dips. Dividend multipliers turn modest monthly saving habits into serious financial independence. Automatic dividend enrollment prevents cash balances from sitting idle in accounts. Compounding acceleration increases significantly during the final years of decades. Consistent reinvestment maximizes share accumulation during all broad market conditions.
| Monthly Index Contribution | 10-Year Out-of-Pocket Cash | Final 10-Year Balance (8% Return) | Total Raw Compounded Gains |
|---|---|---|---|
| $100 / month | $12,000 | $18,417 | $6,417 |
| $300 / month | $36,000 | $55,249 | $19,249 |
| $500 / month | $60,000 | $92,083 | $32,083 |
| $1,000 / month | $120,000 | $184,165 | $64,165 |
| $1,500 / month | $180,000 | $276,248 | $96,248 |
The 10-Year Runway Forecast
S&P 500 Benchmarks, Inflation Adjustments, and Capital Shields
A ten-year horizon provides adequate time for compounding math to flourish. Historical broad market index returns average roughly eight to ten percent. Accounting for long-term inflation preserves real purchasing power evaluation metrics. We list core benchmark metrics and portfolio parameters directly below.
- Historical S&P 500 Baseline: Ten percent nominal return before inflation adjustments.
- Conservative Net Yield Factor: Eight percent annualized growth target for backtesting.
- Real Inflation-Adjusted Drag Factor: Two to three percent purchasing power erosion.
- Decade Horizon Capital Accumulation: Compound returns surpass total out-of-pocket contributions.
- Broad Index Diversification Shield: Spreads single-stock risk across hundreds of equities.
- Low Expense Ratio Benchmark: Zero point zero three percent annual fee drag.
Expense ratios silently bleed portfolio gains when selecting high-cost funds. Choosing broad market index funds keeps annual fee drag extremely low. High-fee active funds undermine long-term exponential growth trajectories for investors. Low-cost indexing preserves maximum capital for the compounding engine to multiply. Market dips in early years allow systematic purchases at discounted valuations. Ten years allows portfolio recoveries from unexpected short-term economic recessions. Disciplined holding strategies prevent permanent capital loss during volatile market cycles. Broad market index funds hold representative shares of dominant global corporations. Diversification protects individual investors against single-company operational bankruptcies. Long-term holding horizons smooth out short-term broad market equity volatility. Consistent investing disciplines convert market fluctuations into long-term wealth opportunities. Asset allocation strategies should align with personal risk tolerance limits. Compounding interest functions best when portfolios remain undisturbed for decades. Cross-check inflation-adjusted projections with the Inflation Calculator and model fund-specific returns with the Mutual Fund Calculator before locking in your decade plan. For broader context on how compounding works, see our Compound Interest Explained guide.
Open Compound Interest Calculator Open Investment Calculator
Frequently Asked Questions
How is compound interest calculated on index funds over 10 years?
Compound interest uses your starting principal, monthly deposits, and annual yield. Use formula A = P(1 + r ÷ n)nt for compounding balances.
Does leaving dividends in your account maximize compound interest growth?
Yes, enabling automated dividend reinvestment accelerates overall share accumulation speed. Reinvested dividends purchase additional shares generating larger future payout cycles.
What average annual return rate should I assume for index funds?
Historical broad market index returns average eight to ten percent annually. Using an eight percent assumption provides a reliable conservative baseline.
How does inflation affect my 10-year compound interest calculations?
Inflation reduces the future purchasing power of your compounded total balance. Subtract two percent from nominal returns to calculate real inflation-adjusted wealth.