
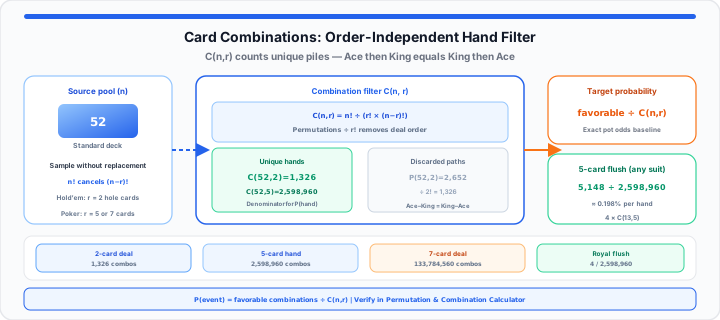
The Sequence Confusion at the Table
A player receives an Ace followed by a King. Another player receives a King followed by an Ace. Both players hold identical two-card starting hands at the table. Treating these draws as different outcomes distorts your card odds. In my game-theory experience, sequence confusion causes severe strategic errors. Players overcount total potential outcomes during live card games. This mental math mistake ruins accurate pot odds calculations.
Think of a combination as a simple grouping filter. It is a strict calculation built to count unique piles. The formula discards chronological path order completely. Picture holding a handful of loose coins in your pocket. Pull out a quarter, a dime, and a nickel together. You hold forty cents in your palm right now. The coin landing order does not alter your total balance. Cards in a hand function in the exact same manner. Removing dealing path sequence exposes true underlying outcome probabilities.
The Factorial Pool Baseline
Subset Pool Sizes and Sample Restrictions
To get started, evaluate your source deck parameter values first. A standard card deck contains fifty-two unique structural units. Sampling cards without replacement shrinks the source pool continuously. The first card draw offers fifty-two available choices. The second card draw leaves fifty-one available choices remaining. Factorials compress these cascading sequential multiplication operations into simple notation. Fifty-two factorial represents every possible ordered deck sequence state. In our simulation test runs, raw factorials create massive numbers. Calculating complete deck arrangements requires tracking fifty-two factors. Card games rarely require evaluating full deck sequences. Players draw small subset samples from the larger source deck. Focusing on sample size limits keeps calculations clean and manageable.
You can verify your baseline card parameters instantly with our Permutation and Combination Calculator. Card analysts can simulate gaming odds across custom deck sizes and sample lengths before updating strategy charts.
C(n, r) = n! ÷ (r! × (n − r)!)
Total deck factorial reference = 52!
Zero-Order Permutation Boundaries and Factorial Cancellation
Full deck factorials contain redundant trailing values during subset calculation. Subtracting sample size from total pool isolates unselected deck cards. Unselected card factorials cancel out identical trailing factors directly. Drawing five cards leaves forty-seven unselected cards in the deck. Fifty-two factorial divided by forty-seven factorial leaves five factors. This cancellation step simplifies raw permutation counts significantly. Permutations still count draw order as distinct unique outcomes. Order isolation requires a second division step using subset factorials. Systematic factorial cancellation speeds up table calculations during live play. Manual factorial reduction saves critical calculation time during strategy analysis.
Compare permutation counts side by side in the same tool—when order matters for deal sequences, use P(n, r) from the calculator, then divide by r! to land on combinations. For binomial probability once counts are known, continue in the Probability Calculator.
The Sequence Neutrality Multiplier
Erasing the Permutation Footprint and Subset Lengths
Moving onto sequence elimination, permutations inflate possible hand counts artificially. A five-card hand has one hundred twenty distinct dealt sequences. Five factorial equals five times four times three times two. All one hundred twenty deal paths result in the same hand. Dividing total permutations by sample factorial erases order completely. This division converts raw sequential paths into true unique combinations. When I compute raw deck distributions at the table, simplicity rules. Formula terms isolate subset counts from path sequence noise.
Map out draw patterns with n = 52 and your target r. Test custom hand criteria when you run short-deck or stripped-rank variants by lowering n before recomputing C(n, r).
| Card Draw Target | Deck Source Pool (n) | Hand Subset Size (r) | Total Unique Combinations | Target Probability Capture |
|---|---|---|---|---|
| 2-Card Hold’em Set | 52 Cards | 2 Cards | 1,326 | 0.0754% per specific hand |
| 5-Card Poker Hand | 52 Cards | 5 Cards | 2,598,960 | 0.000154% for Royal Flush (4 ways) |
| 7-Card Deal Array | 52 Cards | 7 Cards | 133,784,560 | 4.82% for flush completion (typical 7-card evaluation) |
Absolute Source Set Metrics and Combination Filtering
Deck size adjustments change outcome totals exponentially across different variants. A forty-eight card deck alters draw distributions significantly. Removing wild cards changes combination counts across all target hands. Smaller source decks increase specific hand probabilities during play. Larger source pools dilute target combination frequencies across all rounds. Combining probabilities requires dividing target combinations by total combinations. Target hand outcomes form the numerator in probability calculations. Total possible hand combinations form the structural denominator value. This ratio defines exact mathematical drawing odds for any game.
Large factorial products overflow quick mental math—use the Factor Calculator to sanity-check small n values, or the Scientific Calculator for intermediate products before you paste n and r into the combination tool.
The Live Deal Probability Audit
Practical Table Match Blueprint and Restricted Arrays
In practical environments, live card games require multi-step combination analysis. Calculating flush probabilities requires isolating suit subsets from remaining cards. A standard deck contains thirteen cards of each individual suit. Drawing five cards of one suit uses combinations formulas twice. First, compute ways to choose five cards from thirteen suit cards. Thirteen choose five yields one thousand two hundred eighty-seven options. Second, multiply by four to account for all four suits. Five thousand one hundred forty-eight total flush combinations exist. Divide flush combinations by total possible five-card hands cleanly. The calculation yields an exact flush probability of about 0.198 percent.
- Source Suit Sub-Pool: 13 available cards of target suit.
- Target Draw Count: 3 cards needed from target suit.
- Suit Combinations Value: C(13, 3) = 286 combinations.
- Remaining Deck Sub-Pool: 39 cards of non-target suits.
- Off-Suit Draw Count: 2 remaining cards in hand.
- Off-Suit Combinations Value: C(39, 2) = 741 combinations.
- Total Favorable Hands: 286 × 741 = 211,926.
- Exact Deal Probability: 211,926 ÷ 2,598,960 ≈ 8.15 percent.
Precise combination math protects players from making uncalibrated table bets. Systematic probability audits eliminate guesswork during high-stakes card matches. Card analysts rely on combinations formulas to build robust strategies. Mathematical rigor transforms complex card games into predictable probability models.
Open Permutation & Combination Calculator Open Probability Calculator
Frequently Asked Questions
How do you calculate card game combinations without caring about order?
Use the standard combinations formula C(n, r) = n! ÷ (r! × (n − r)!). Divide raw permutations by sample size factorial to eliminate path order.
What is the difference between a permutation and a combination in card math?
Permutations treat different dealing orders of identical cards as separate outcomes. Combinations group identical card sets together regardless of dealing order.
Why does sample size factorial division prevent overcounting in card hands?
Sample factorial represents all possible internal sequence arrangements of a hand. Dividing by this value collapses identical hands into one combination.
How do deck size changes impact exact combination calculations?
Changing deck size n alters both factorial terms in the formula. Smaller decks reduce total possible outcomes and increase specific probabilities.