
Checking your brokerage portfolio on a Sunday night while dreading the upcoming work week is a familiar ritual for mid-career professionals. You see a seven-figure balance, but the golden handcuffs still feel tight. You wonder whether that number actually clears you for total financial freedom, or if stepping away from your salary today will leave you short two decades down the road.
In my experience mapping multi-decade drawdown structures for clients, this paralysis comes from viewing wealth as a static pile of cash rather than an active life-support system.
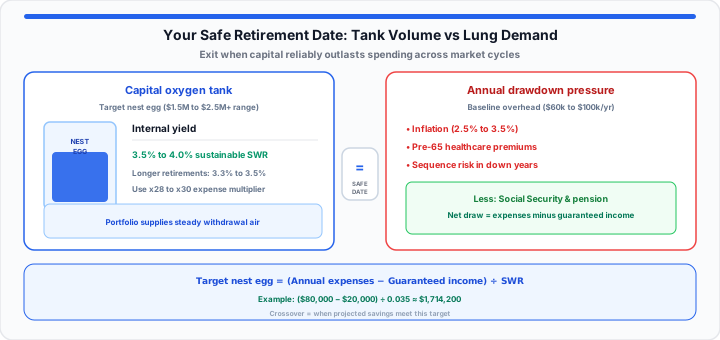
Think of your total retirement nest egg like a heavy, custom-built deep-sea oxygen tank clamped to your back for an extended dive. Your annual living expenses represent the exact pressure volume your lungs demand per minute. If you miscalculate that rate of consumption or ignore underwater currents like persistent monetary inflation, you risk running out of air long before returning to the surface. Your safe retirement date is not an arbitrary age set by a corporate HR manual—it is the exact threshold where your capital oxygen tank reliably matches the remaining depth of your dive.
The Guesswork Trap: Why Baseline Nest Egg Totals Ignore Real Longevity Pressures
When I’m auditing asset burn rates for clients, the primary flaw I discover in back-of-the-napkin retirement planning is relying on static, flat-rate targets. Staring at a neat headline goal like $1.5 million or $2 million provides a temporary sense of security, but raw numbers mean nothing without context.
Real-world retirements do not happen inside a calm laboratory environment. Three major structural forces routinely wreck unhedged retirement timelines:
- Sequence of returns risk: Experiencing a severe market crash during the first three to five years of your drawdown phase forces you to sell depreciated assets to cover baseline bills, permanently shrinking your portfolio’s recovery capacity.
- The pre-Medicare healthcare gap: Stepping away from a corporate job at age 55 means funding private health insurance for a decade before Medicare kicks in at 65, creating a massive, temporary surge in fixed costs.
- Purchasing power decay: Even a modest 2.5% inflation rate cuts your real dollar purchasing power nearly in half across a 30-year retirement window. Model erosion with the Inflation Calculator before you lock in a spending target.
Your exit date is locked when tank volume safely outlasts total lung demand across all market conditions.
Step-by-Step: The Fiduciary Method for Manual Retirement Date Sizing
To convert your current investment portfolio into an exact, stress-tested departure timeline, portfolio survival testing relies on a four-step actuarial framework:
- Pin your true annual cost baseline: Calculate your core annual spending, then subtract career-specific overhead like commuting costs, professional wardrobes, and mandatory retirement contributions. Next, add back out-of-pocket health premiums and discretionary travel allocations to find your true post-work cash requirement.
- Apply your multiplication anchor: Multiply your net annual spending by your target duration multiplier. For a standard 30-year horizon, multiplying by 25 (the inverse of the traditional 4% rule) establishes your base capital target. For an early exit spanning 40+ years, use a safer multiplier of 28 to 30 (reflecting a 3.3% to 3.5% withdrawal rate).
- Factor in non-portfolio cash inflows: Subtract the present value of guaranteed future income streams—such as Social Security, private annuities, or pension payouts—from your primary annual cost burden before calculating your final asset goal. Estimate Social Security with the Social Security Calculator and fixed pensions with the Pension Calculator.
- Identify your capital crossover window: Track the point where your annual net investment growth plus ongoing savings contributions intersect your required nest egg target. The Investment Calculator and Compound Interest Calculator help stress-test growth paths while you are still accumulating.
The core mathematical equation for your capital goal looks like this:
Target Nest Egg = (Projected Annual Living Expenses − Guaranteed Income) × (1 ÷ Safe Withdrawal Rate)
For instance, if your target post-work spending is $80,000 per year, and you expect $20,000 per year in Social Security benefits, your net portfolio draw requirement is $60,000. Applying a conservative 3.5% safe withdrawal rate (1 ÷ 0.035 = 28.57):
Target Nest Egg = $60,000 × 28.57 = $1,714,200
To map your personal runway without drowning in manual math, drop your current net worth, savings rate, and income assumptions into our interactive Retirement Calculator to see projected savings, nest egg needed, percent funded, and your capital crossover timeline. For a full walkthrough of each input, see the Ultimate Retirement Savings Calculator Guide.
The 4% Rule Under the Microscope: Adjusting for Modern Market Shifts
The classic 4% rule, developed by financial planner William Bengen in 1994, was designed to prevent a retirement portfolio from running out of money over a 30-year period based on historical US market cycles. However, applying a rigid 4% withdrawal rate blindly in today’s market conditions can introduce unnecessary risk for early retirees.
In practical environments, rigid withdrawal rates fail because humans do not spend money like robots. Dynamic withdrawal strategies—such as lowering your inflation adjustments following down-market years or setting spending guardrails—drastically reduce your required target balance. Trimming your distributions by just 10% during market contractions protects your principal tank, allowing your remaining capital to rebound rapidly when equity markets recover.
The Multi-Generation Readiness Matrix: Tracking Timelines to Freedom
To demonstrate how different savings weights and starting balances dictate your final exit window, here is a comparison across three representative household profiles assuming a 7% net real market return (adjusted for inflation):
| Household Profile Strategy | Current Age | Starting Net Worth | Monthly Savings Weight | Target Annual Expenses | Required Nest Egg Target | Projected Years to Exit Window |
|---|---|---|---|---|---|---|
| Aggressive Early Exit | Age 35 | $150,000 | $3,500 / month | $60,000 | $1,714,200 | 14.5 years (Age 49) |
| Steady Mid-Career Planner | Age 45 | $450,000 | $2,000 / month | $80,000 | $2,000,000 | 13.2 years (Age 58) |
| Late-Stage Restructurer | Age 52 | $300,000 | $4,000 / month | $70,000 | $1,750,000 | 12.8 years (Age 65) |
Notice how the aggressive early exit track relies heavily on a high savings rate to offset a smaller starting balance, whereas the mid-career planner uses existing portfolio compounding to reach the safety line. Re-run any row in the Retirement Calculator with your own numbers to replace the illustrative ages.
Frequently Asked Questions
- How do you accurately calculate the exact age or date you can afford to retire?
- You determine your exact retirement date by identifying the point where your accumulated capital assets multiplied by your safe withdrawal rate equal or exceed your projected annual living expenses. Subtract your expected guaranteed income (like Social Security or pensions) from your overall budget, then calculate the capital required to cover the remaining gap.
- What is the standard mathematical formula used to figure out retirement readiness?
- The baseline mathematical formula is Required Capital = (Annual Living Costs − Guaranteed Annual Income) ÷ Safe Withdrawal Rate. For example, needing $50,000 from your portfolio with a 4% withdrawal rate requires $50,000 ÷ 0.04 = $1,250,000 in total invested assets.
- How does sequence of returns risk impact your portfolio if you retire during a market drop?
- Sequence of returns risk occurs when market declines happen early in your retirement. Withdrawing living expenses from a declining portfolio accelerates asset depletion, leaving less capital behind to recover during subsequent bull markets. You can mitigate this risk by maintaining two years of living expenses in cash or short-term bonds.
- How do healthcare costs before age 65 change my target exit date?
- Retiring before Medicare eligibility at age 65 requires budgeting for private health insurance premiums and out-of-pocket maximums. Adding $12,000 to $20,000 per year in temporary healthcare costs before age 65 increases your required pre-retirement cash reserves or temporarily elevates your required nest egg target.
Map your safe retirement date in the Retirement Calculator